
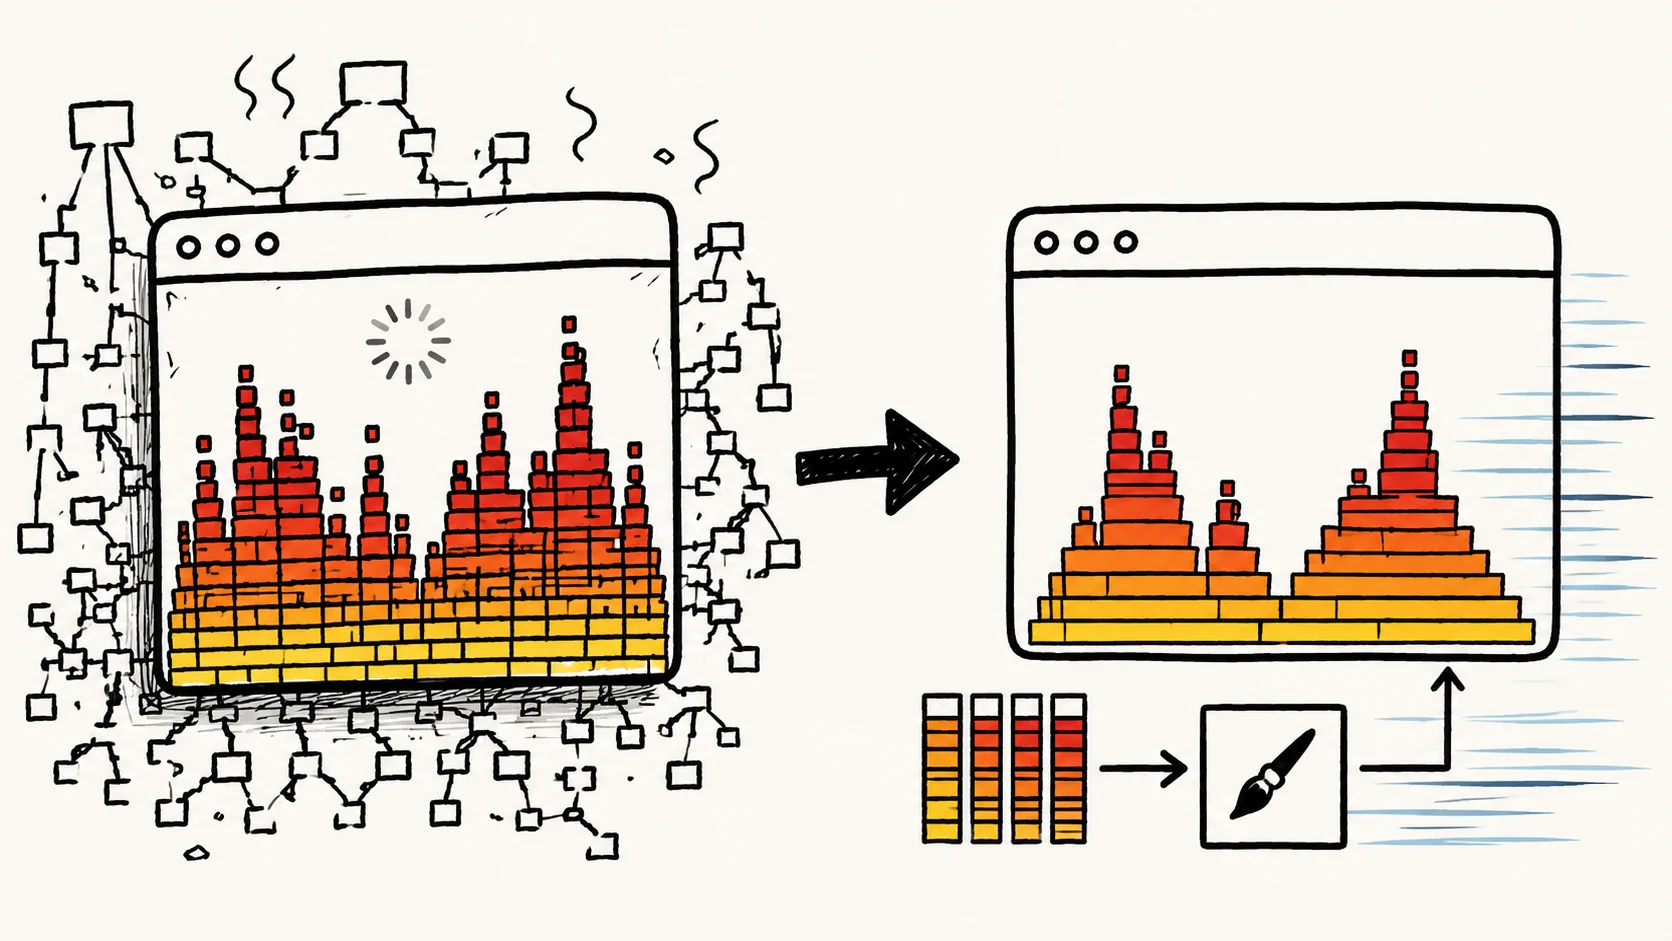
Polar Signals has rebuilt the flame graph renderer in its continuous profiling dashboard, moving from SVG to Canvas. The company's own fixture-replay and live-browser benchmarks show render times falling by roughly 3.6x in a controlled test and up to 14x on a live, busy page.
Why Tens Of Thousands Of DOM Nodes Broke Polar Signals' Flame Graph
A flame graph frame is drawn as a rectangle with a text label on top of it, and a large profile can contain tens of thousands of them. In an SVG implementation, each of those frames is a <rect> and a <text> DOM element, and the browser has to style, lay out, paint, and eventually garbage-collect every single one. To keep a large profile from freezing the tab, the old renderer drew nodes in batches of roughly 500 per animation frame — a workaround for the underlying problem rather than a fix for it.
That underlying problem is the difference between retained-mode and immediate-mode rendering. SVG and the DOM are retained-mode: the browser owns a tree of elements and re-computes styles and layout for the whole tree whenever something in it changes. Canvas is immediate-mode: there's a drawing surface and a set of draw commands like fillRect, and once a shape is painted, the browser forgets it was ever there. Nothing is retained, so there's nothing left over for the garbage collector to clean up.
This wasn't Polar Signals' first attempt at fixing the scaling problem. A September 2025 rewrite pre-computed each frame's vertical position (depth) and horizontal position (value offset) on the backend during flame graph construction, eliminating a recursive tree traversal that had been happening in the browser on every render. Paired with viewport culling — skipping frames outside the visible depth range and visible horizontal window — that change alone took the render of a large query from around eight seconds down to about 91 milliseconds. The Canvas switch documented in the July 2026 post picks up from there, and the timeline below traces both steps.
Pre-Computed Arrow Columns Turn The Draw Loop Into A Single Loop
The Canvas switch only works as well as it does because of a second change that happened first: Polar Signals rewrote its querier and database in Rust, and the flame graph became the direct output of a SQL query rather than something assembled afterward in the browser. The backend walks the samples, builds the tree, and computes every frame's position and width once, then streams the result as columnar Apache Arrow data — the same field (all the left edges, all the widths, all the depths) stored contiguously rather than as a collection of separate per-frame objects, which is what the Arrow columnar format specification is designed to optimize for.
That data arrives over Arrow Flight in Arrow's IPC format, and because Arrow's on-the-wire layout is identical to its in-memory layout, the frontend can hand the bytes to a tableFromIPC call and get a usable table back with no parsing or copying step in between. This is the detail that makes the rest of the rewrite work: the draw loop for each frame is just reading a value out of a column and calling fillRect, with no JavaScript object or SVG element created per frame to be tracked and later reclaimed.
Viewport culling, carried over from the September 2025 SVG work, still limits how much of that data actually gets drawn: a 50,000-frame profile with only 800 frames inside the visible region results in roughly 800 draw calls, not 50,000. Canvas alone wouldn't have produced this result — a canvas draw loop still calling recursive tree logic per frame would just move the same cost to a different API. What actually removes the cost is the combination: positions decided once upstream in a query, delivered as flat columns, read directly into pixels.
The Benchmarks: 3.6x Faster In Isolation, Up To 14x On A Busy Tab
Rather than rely on the internal impression that the dashboard simply "feels faster," Polar Signals measured the change three separate ways: fixture replay to isolate the renderer from the network and the query, browser automation to capture what a user actually experiences, and Chrome DevTools traces to see where the browser's time was going.
The most controlled comparison replays the exact same Arrow response — a two-day, deep, large on-CPU query — through the old SVG renderer and the new Canvas renderer, with no server and no network involved. Because the two renderers group stacks slightly differently, the resulting trees aren't identical in size (17,889 frames for SVG versus 16,515 for Canvas), so the company reports both the total time and the time per frame to keep the comparison fair.
That isolated test puts Canvas at about 3.6x faster overall and 3.3x faster per frame — 9.2 microseconds down to 2.8 microseconds. Polar Signals calls this the number it trusts most, because it's repeatable and holds the query and network constant. The picture changes once the same comparison runs on the actual product pages, with the query, the network, and the rest of the app all competing for the same main thread.
On the live pages, resetting a zoomed-in view — the worst case on the old renderer — dropped from about 528ms to 47ms, and first render went from 448ms to 42ms, both bigger multiples than the isolated 3.6x figure. Polar Signals attributes that gap not to the renderer changing between the two tests, but to contention: on a live page the old SVG renderer competes with everything else for a single main thread, so its time swings from around 450ms to over a second run to run, while the isolated 3.6x is described as the fair, repeatable number and the live figures as what a user actually feels on a busy tab.
The third measurement targeted interaction quality rather than raw render time: a scripted hover sweep over both renderers with the CPU throttled 15x to simulate a slower machine.
That last set of numbers is arguably the most telling for day-to-day use: it's not just that Canvas renders faster once, it's that hover interactions stay smooth under load, where the old renderer visibly stuttered.
What Canvas Takes Away: Hit-Testing, Screen Readers, And Text Selection
None of this speed is free, and Polar Signals is explicit about what it gave up. Everything the DOM handled automatically now has to be rebuilt by hand. Because a canvas has no elements to receive a click or a hover, hit-testing is done by inverting the same math used to draw a frame — dividing the pointer's y-position by the row height to find the row, then scanning that row's frames left to right to find the one under the cursor. There's no native :hover, so the hovered frame is tracked in application state and the tooltip is rendered separately on top of the canvas. There's no text-overflow: ellipsis, so every label has to be measured and truncated manually before it's drawn, and because a canvas is a bitmap, it has to be scaled by the screen's device pixel ratio or it renders soft on a high-resolution display.
The trade-off the company treats most seriously is accessibility: a canvas is opaque to a screen reader, and text on it can't be selected the way SVG text could. Polar Signals states plainly that it doesn't have a full solution for this yet and is continuing to look for one — a limitation worth weighing for any team that depended on the old renderer's SVG text being selectable or exposed to assistive technology, even as the performance numbers make a strong case for the switch on their own terms.
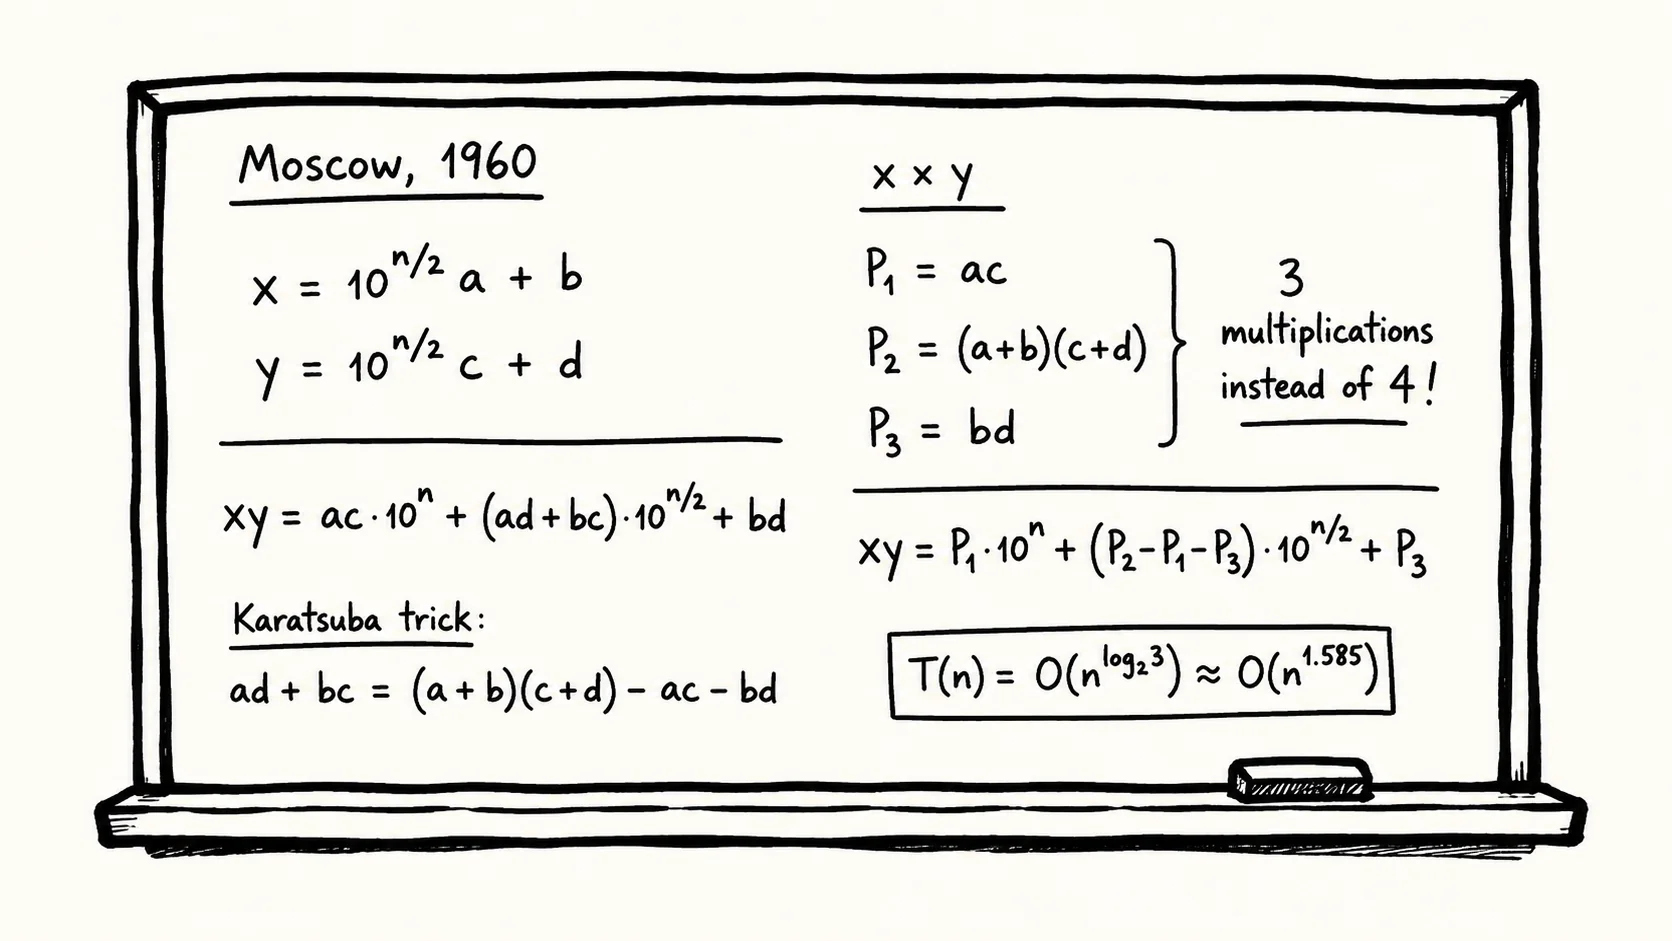
How a 23-Year-Old Disproved Math's Assumed Speed Limit for Multiplication
In 1960, 23-year-old Anatoly Karatsuba disproved a conjecture on the fastest way to multiply numbers, cutting operations from 1,000,000 to under 57,000.

From $0.01-a-Day HTML to Per-Second Billing: How Website Hosting Splits in 2026
Railway, Vercel, and Cloudflare now bill by the second, while Neatnik's IndieWeb guide pushes $0.01-a-day HTML — here's what 2026 hosting tiers actually cost.

Kaiser Nurses Say AI Scoring and 15-Minute Call Caps Are Undermining Patient Care
Kaiser nurses say AI tone-monitoring and strict call-length scoring push them to cut corners with patients, as new contract talks begin in 2026.
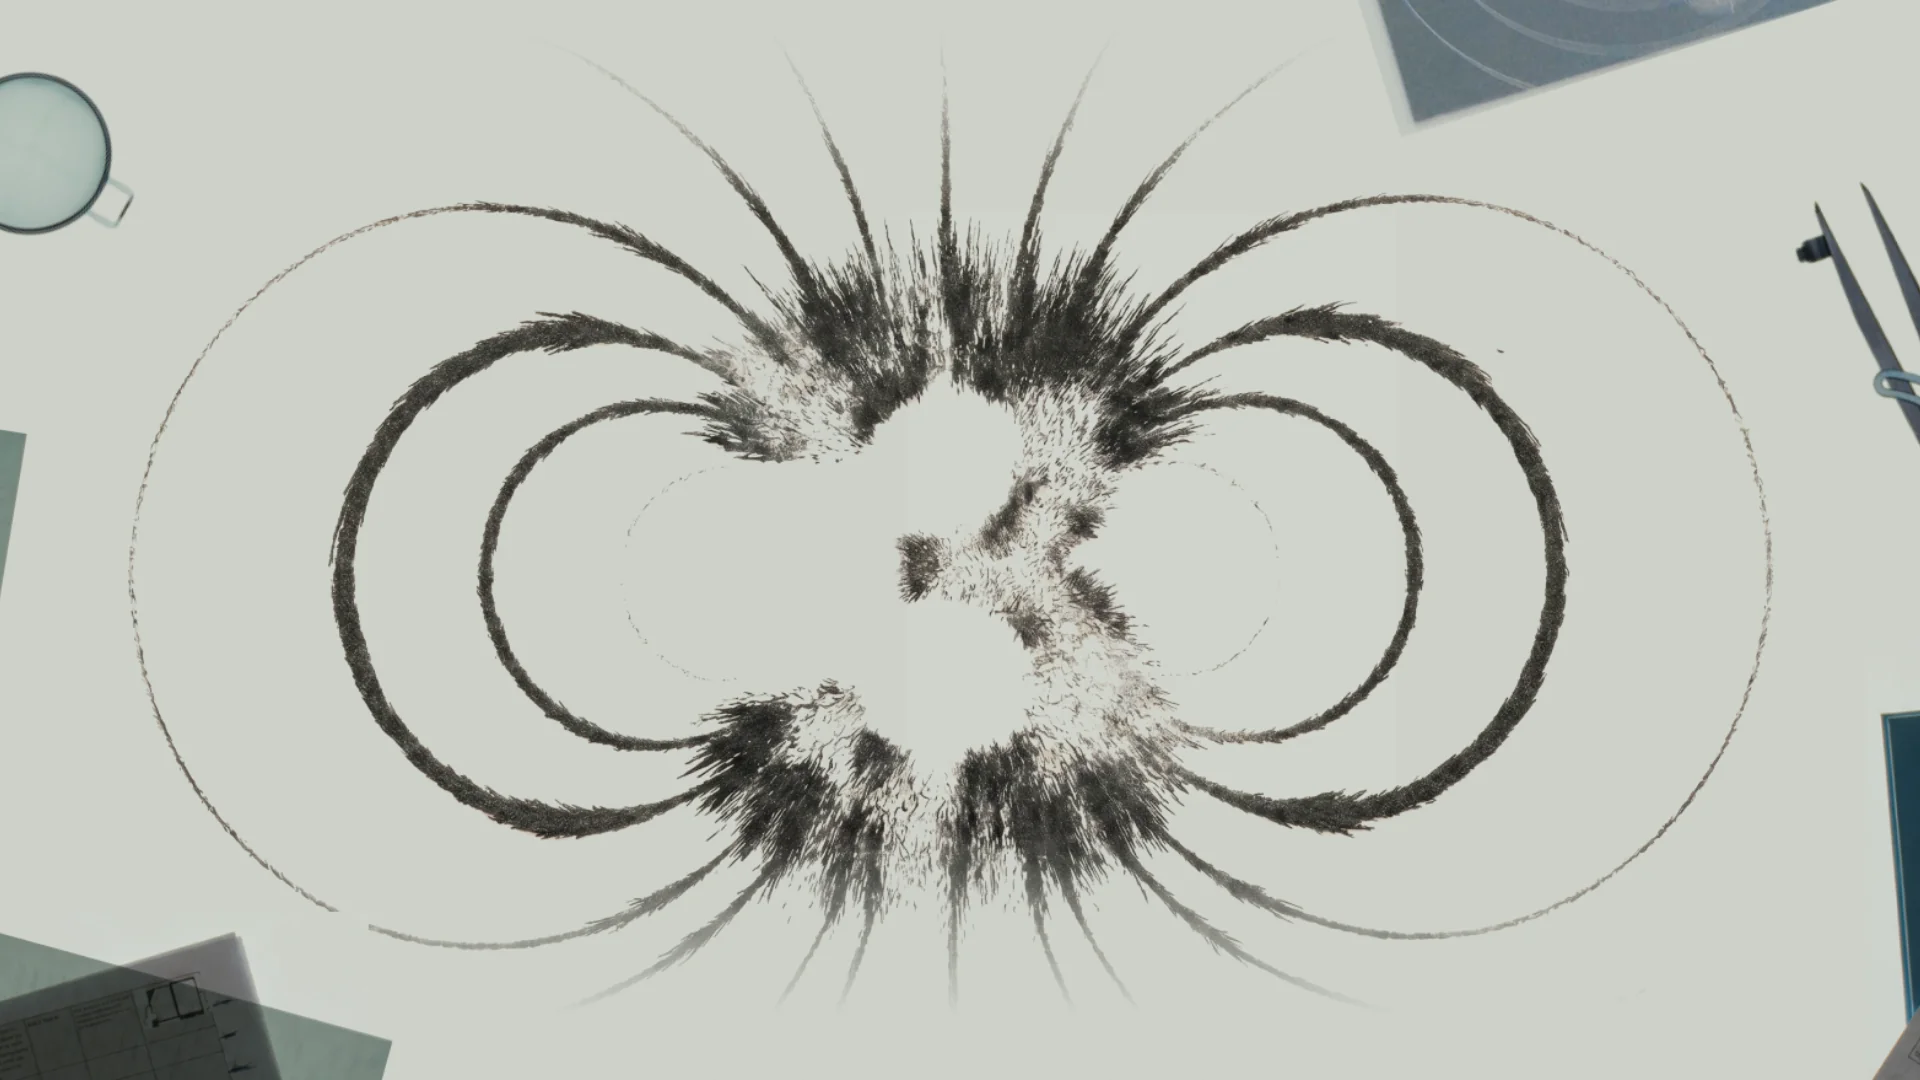
Kimi K3 Debuts as the First Open 3-Trillion-Parameter Model, Trailing Fable 5 and GPT 5.6 Sol
Moonshot AI's Kimi K3 is the first open 2.8-trillion-parameter model, beating open rivals on benchmarks but trailing Claude Fable 5 and GPT 5.6 Sol overall.
Comments (0)
Please sign in to join the discussion.
No comments yet.
Be the first to share your perspective on this topic.