

Most SaaS post-mortems point to the same final moment: the company ran out of money. Newer data from CB Insights and Carta suggests that's rarely where the story actually starts.
Cash Deaths Are the Symptom CB Insights Now Separates From the Cause
CB Insights analyzed 431 VC-backed companies that shut down since 2023, updating an older, smaller post-mortem study. Running out of capital was cited in 70% of failures — the most common reason founders gave — but the firm treats that as the final event, not the underlying problem. Poor product-market fit was cited in 43% of cases, bad timing or macro conditions in 29%, and unsustainable unit economics in 19%. Because many companies cited more than one reason, the figures add up to more than 100%. The 431 companies had raised a combined $17.5 billion before shutting down, with a median raise of $11 million — evidence that access to capital didn't prevent the underlying demand problem from surfacing eventually.
Carta's Data Show the 2021 Funding Vintage Reaching Its Wall
The timing behind that pattern shows up clearly in Carta's records. U.S.-based startups on the platform shut down at a rate of 966 in 2024, up 25.6% from 769 in 2023. Carta's head of insights, Peter Walker, told TechCrunch this wasn't a sign VCs had gotten worse at picking winners — it reflected more companies funded during the 2020–2021 boom simply reaching the end of their runway on schedule. Separate data from SimpleClosure, cited in the same reporting, found 74% of shutdowns since 2023 were at the pre-seed or seed stage, with 41% specifically at seed. CB Insights' companion figure — a median of 22 months between a startup's last fundraise and its eventual shutdown — lines up with that timeline almost exactly.
Enterprise SaaS Absorbed the Largest Share of the 2024 Wave
Not every sector felt the runway squeeze equally. Of the 2024 shutdowns Carta tracked, enterprise SaaS accounted for 32% — the largest share by a wide margin — followed by consumer at 11%, health tech at 9%, fintech at 8%, and biotech at 7%. Walker noted the breakdown roughly mirrors where 2020–2021 funding actually went, which he read as evidence the wave was driven by macro conditions rather than any one sector underperforming. For enterprise SaaS specifically, that means the category with the most companies funded during the boom is now the category absorbing the most closures during the reckoning.
Inference Costs Are Reshaping Margins for AI-Native SaaS Entrants
A newer, structurally different failure mode is emerging alongside the classic product-market-fit story. Traditional SaaS built its reputation on gross margins in the 70–90% range — build once, serve many users for marginal cost. As reported by TechBasics, AI-native SaaS products face a different economics: every user query calls a model, so gross margins for AI-native SaaS companies run closer to 50–60% even as inference costs across the frontier AI industry have fallen sharply since 2023. That's a single outlet's estimate rather than an audited industry figure, so it should be read as directional rather than precise — but it points to a failure mode that isn't about demand at all. A company can have real product-market fit and still struggle if its per-user cost structure never approaches legacy SaaS margins.
Taken together, the data points to two distinct failure tracks rather than one. The older track is the classic CB Insights pattern: a company builds something the market doesn't urgently need, spends 18 to 22 months discovering that, and runs out of cash trying to fix it. The newer track doesn't require a demand problem at all — it's a margin problem baked into serving AI features at inference-time cost. Both tracks converge on the same outcome, but a founder trying to diagnose which one they're in needs different evidence: customer validation data for the first, and unit-economics modeling for the second.

The Retirement Countdown: What to Fix at 5 Years, 3 Years and 1 Year Out
Retirement checklist: what advisors say to fix at 5, 3 and 1 year out — Social Security claiming order, IRA withdrawal sequencing and a 2028 tax deadline.
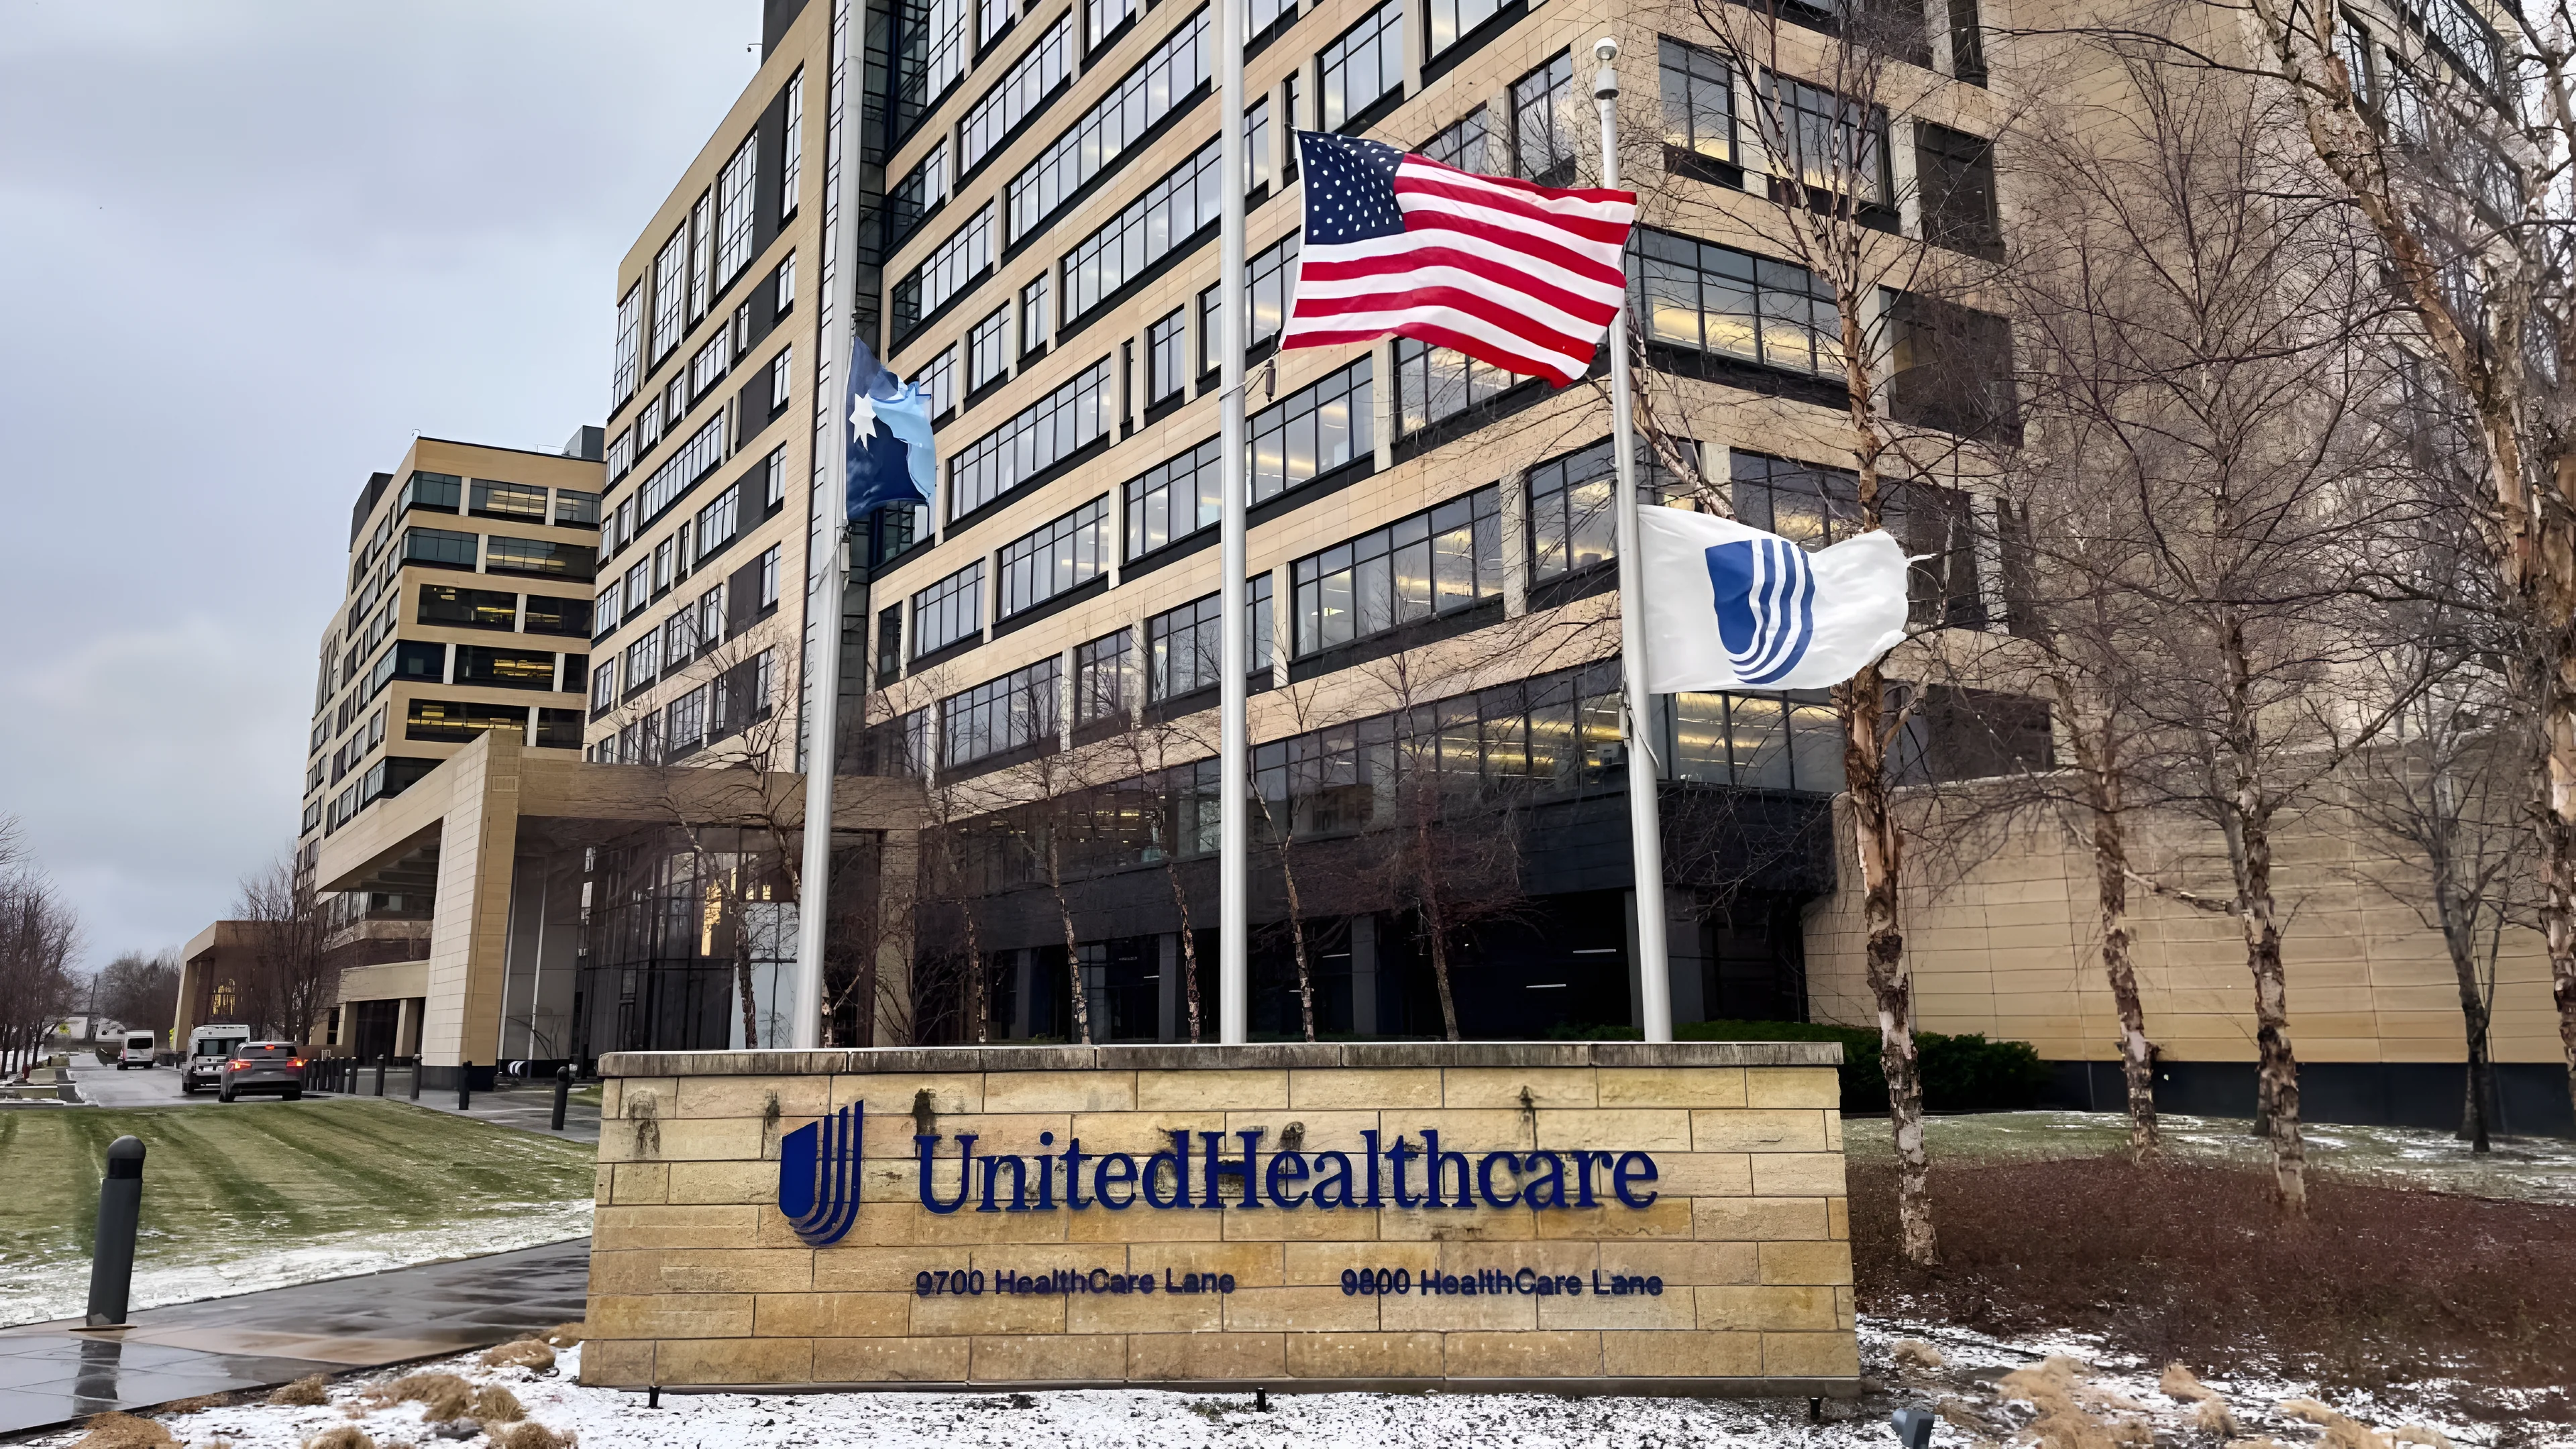
UnitedHealth's Adjusted EPS of $6.38 Beats Estimates by 30% as It Sheds Members for Margin
UnitedHealth posted $6.38 adjusted EPS in Q2 2026, beating estimates by 30%, as medical costs eased to 86.7% and full-year guidance rose to $19.50–$20.00.

Valuations Are Nearing Dot-Com Peaks: Is a 2026 Market Crash Imminent?
The S&P 500's Shiller CAPE ratio hit 41.76 and the Buffett Indicator sits near 214%, levels unseen since just before 2000 — here's what history suggests next.

CoreWeave and Nebius Are Chasing $145 Billion in AI Deals on $16 Billion of Revenue
Microsoft, Meta and Nvidia have committed more than $145 billion to neoclouds CoreWeave and Nebius, whose combined 2026 revenue is projected near $16 billion.
Comments (0)
Please sign in to join the discussion.
No comments yet.
Be the first to share your perspective on this topic.