New CDC modeling published June 5 warns that the Bundibugyo Ebola outbreak in the Democratic Republic of the Congo could exceed 20,000 cases within three months — a scale that would rival the worst Ebola epidemic on record — unless patient isolation rates are substantially and rapidly improved.
A Detection Failure Set the Outbreak's Trajectory Early
The outbreak's current trajectory traces in part to a diagnostic error made at the start. Health officials initially ran tests calibrated for a different Ebola strain, missing early Bundibugyo cases while unrecognized transmission chains continued through February 2026. By the time the World Health Organization declared a Public Health Emergency of International Concern in May 2026, the virus had gained weeks of uncontested spread.
That delay matters operationally. Contact-tracing effectiveness degrades with each generation of transmission that goes undetected, and the data gaps created by those early missed cases now compound the uncertainty in every subsequent model. A fuller account of why standard diagnostic tools failed early detection is available in our earlier reporting.
The chart below traces the outbreak's key milestones from the estimated start of undetected transmission through the CDC's June 5 model release.
What the Reported Numbers Show — and Where They Break Down
As of June 5, Africa CDC reported approximately 400 confirmed cases and 63 deaths. The implied case fatality rate of roughly 16% is within the historical range for Bundibugyo — but public health experts have been explicit that the confirmed figures are almost certainly significant undercounts. Community transmission is going undetected, and data backlogs in a conflict-affected region mean real-time surveillance is structurally incomplete.
The Bundibugyo strain compounds this picture in a specific way that distinguishes this outbreak from past Ebola responses: there are currently no approved treatments or vaccines for it. The tools that helped shorten the 2018–2020 DRC Zaire outbreak — monoclonal antibody therapies, the rVSV-ZEBOV vaccine — are not applicable here. Clinicians are operating with supportive care only, which raises both the individual mortality risk and the pressure on isolation infrastructure to substitute for treatment efficacy.
The three metric cards below reflect the reported figures as of June 5, with the caveat that all three are likely floor estimates.
The Isolation Variable Is the Central Lever — and the Hardest to Pull
The CDC's modeling is not a single prediction. It is a set of scenarios driven primarily by one variable: what fraction of infectious patients are successfully isolated before they transmit further. The current rate sits at the low end of the modeled range. The model suggests that if isolation rates can be raised to 50%, the eventual case count could be held closer to 12,000 — still severe, but meaningfully below the worst-case track. At 70% isolation, that figure could approach 10,000.
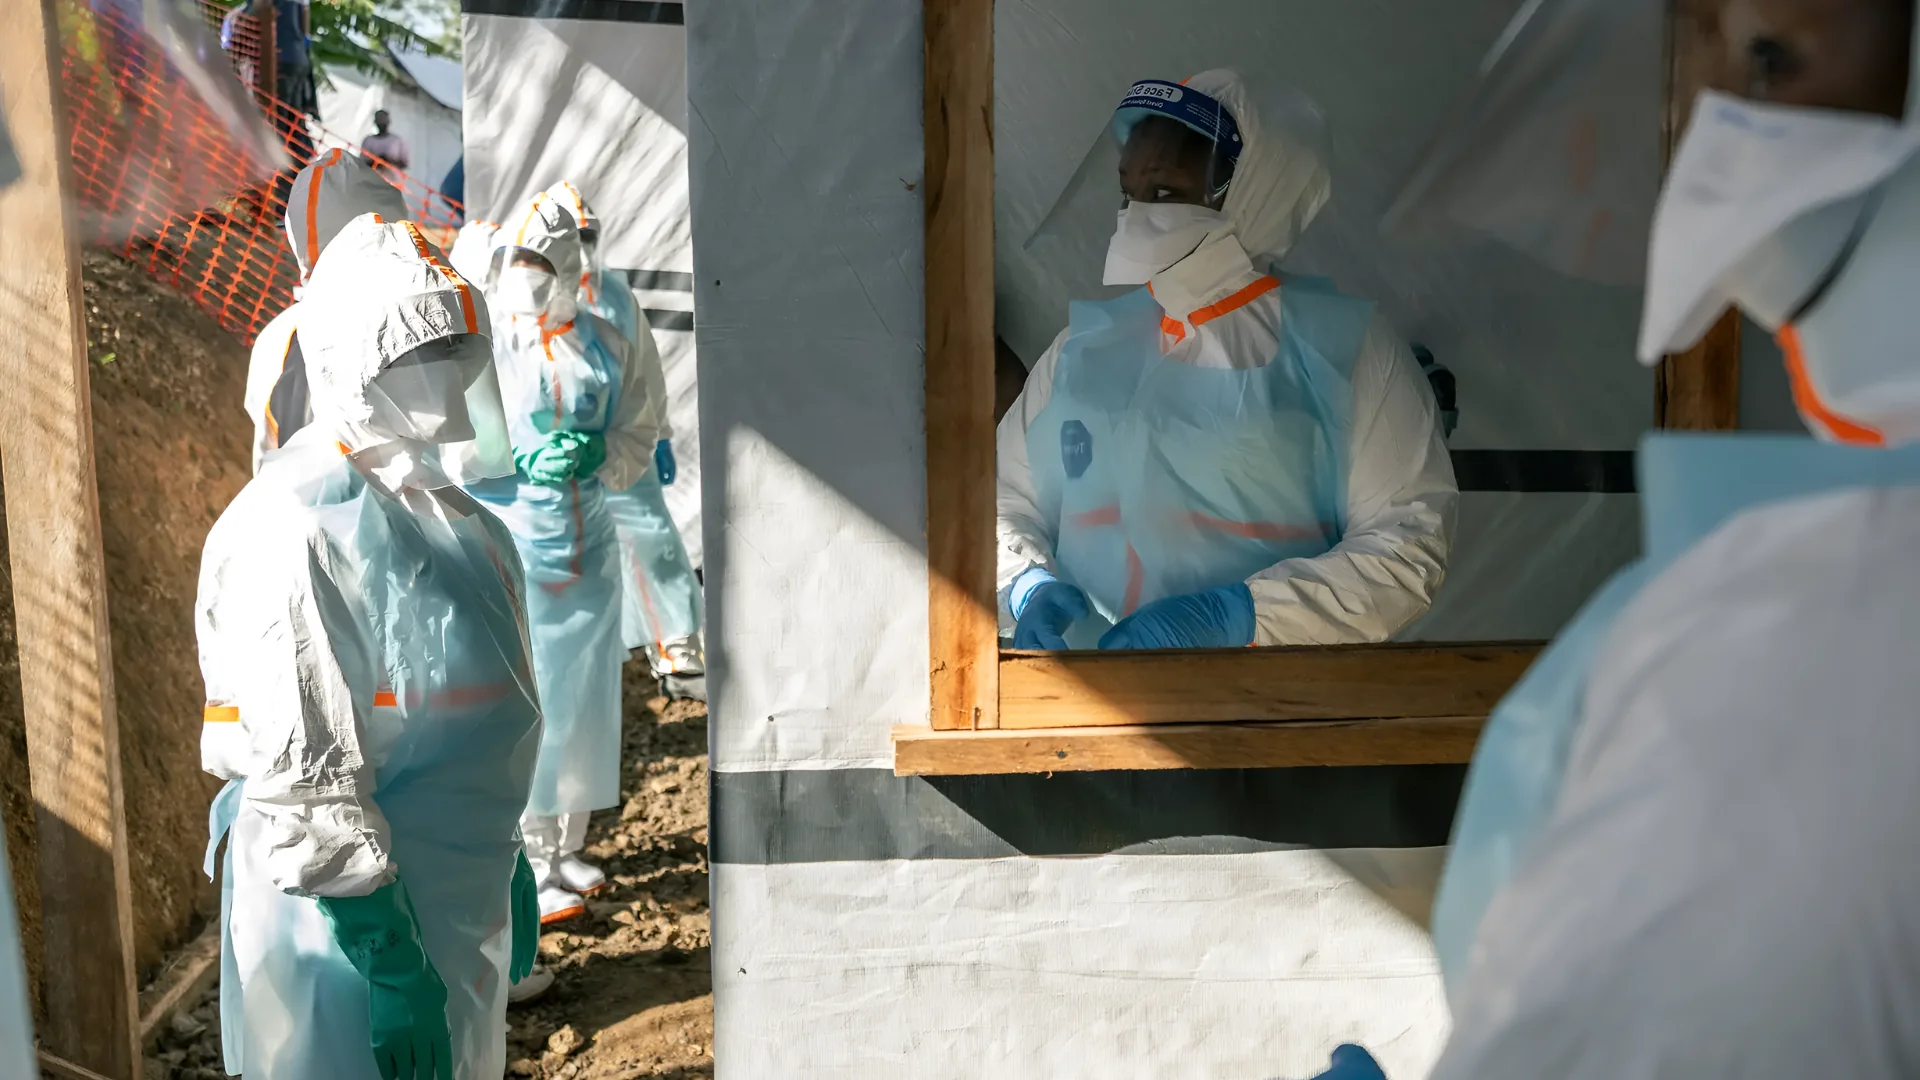
Those thresholds sound achievable in an abstract public health context. In the DRC's eastern provinces, where the M23 rebel group backed by Rwanda and the Islamic State-affiliated ADF are both active, they represent an enormous logistical challenge. Civilian displacement disrupts community-level contact-tracing. Armed checkpoints impede movement of response teams. Establishing and staffing isolation clinics in contested territory is both dangerous and operationally uncertain, as the ongoing containment crisis has documented.
The modeling itself comes with expert-flagged caveats. Jennifer Nuzzo, director of Brown University's Pandemic Center, said the data affirms a dangerous trajectory but urged caution about treating specific numbers as predictions, noting that accurate projection is very difficult with limited early data. That caution is historically grounded: in 2014, a CDC model projected up to 1.4 million cases in a no-intervention scenario — more than fifty times the actual final toll of roughly 28,600. Models built on sparse early surveillance data carry wide uncertainty bands, and the current dataset includes acknowledged gaps from the February detection failure.
The chart below places the CDC's current scenario range against the 2014 West Africa outbreak's final confirmed case count, illustrating both the scale of the warning and the distance that effective isolation could make.
Dr. Satish Pillai, the CDC's Ebola Response Incident Manager, said in published remarks that without strong public health interventions, the modelling suggests an outbreak of that scale is possible. The framing is deliberate: the model is designed to communicate what could happen if current conditions persist, not to forecast what will.
What the model does establish, beyond its specific numbers, is that the current isolation rate is inadequate and that each week without improvement narrows the window for avoiding the higher end of the range. The Bundibugyo strain's treatment gap removes the backstop that pharmaceutical interventions provided in prior outbreaks. That leaves isolation — difficult, dangerous, and operationally constrained by active conflict — as the primary mechanism available to change the trajectory.

Alpha-Gal Syndrome: What a Tick Bite Does to Your Diet
Alpha-gal syndrome is a delayed food allergy caused by tick bites that sensitizes the immune system to a sugar molecule found in mammalian meat. Cases are surging in the Midwest and Northeast, with new state-level reporting mandates and federal labeling legislation underway.

ACOG Breaks from CDC on Maternal Vaccines in 2026
American College of Obstetricians and Gynecologists releases its own maternal vaccine schedule backing influenza, COVID-19, Tdap, and RSV shots, defying CDC rollbacks and countering RFK Jr.-era misinformation.
Ebola Bundibugyo Outbreak DRC: 676 Cases, No Vaccine
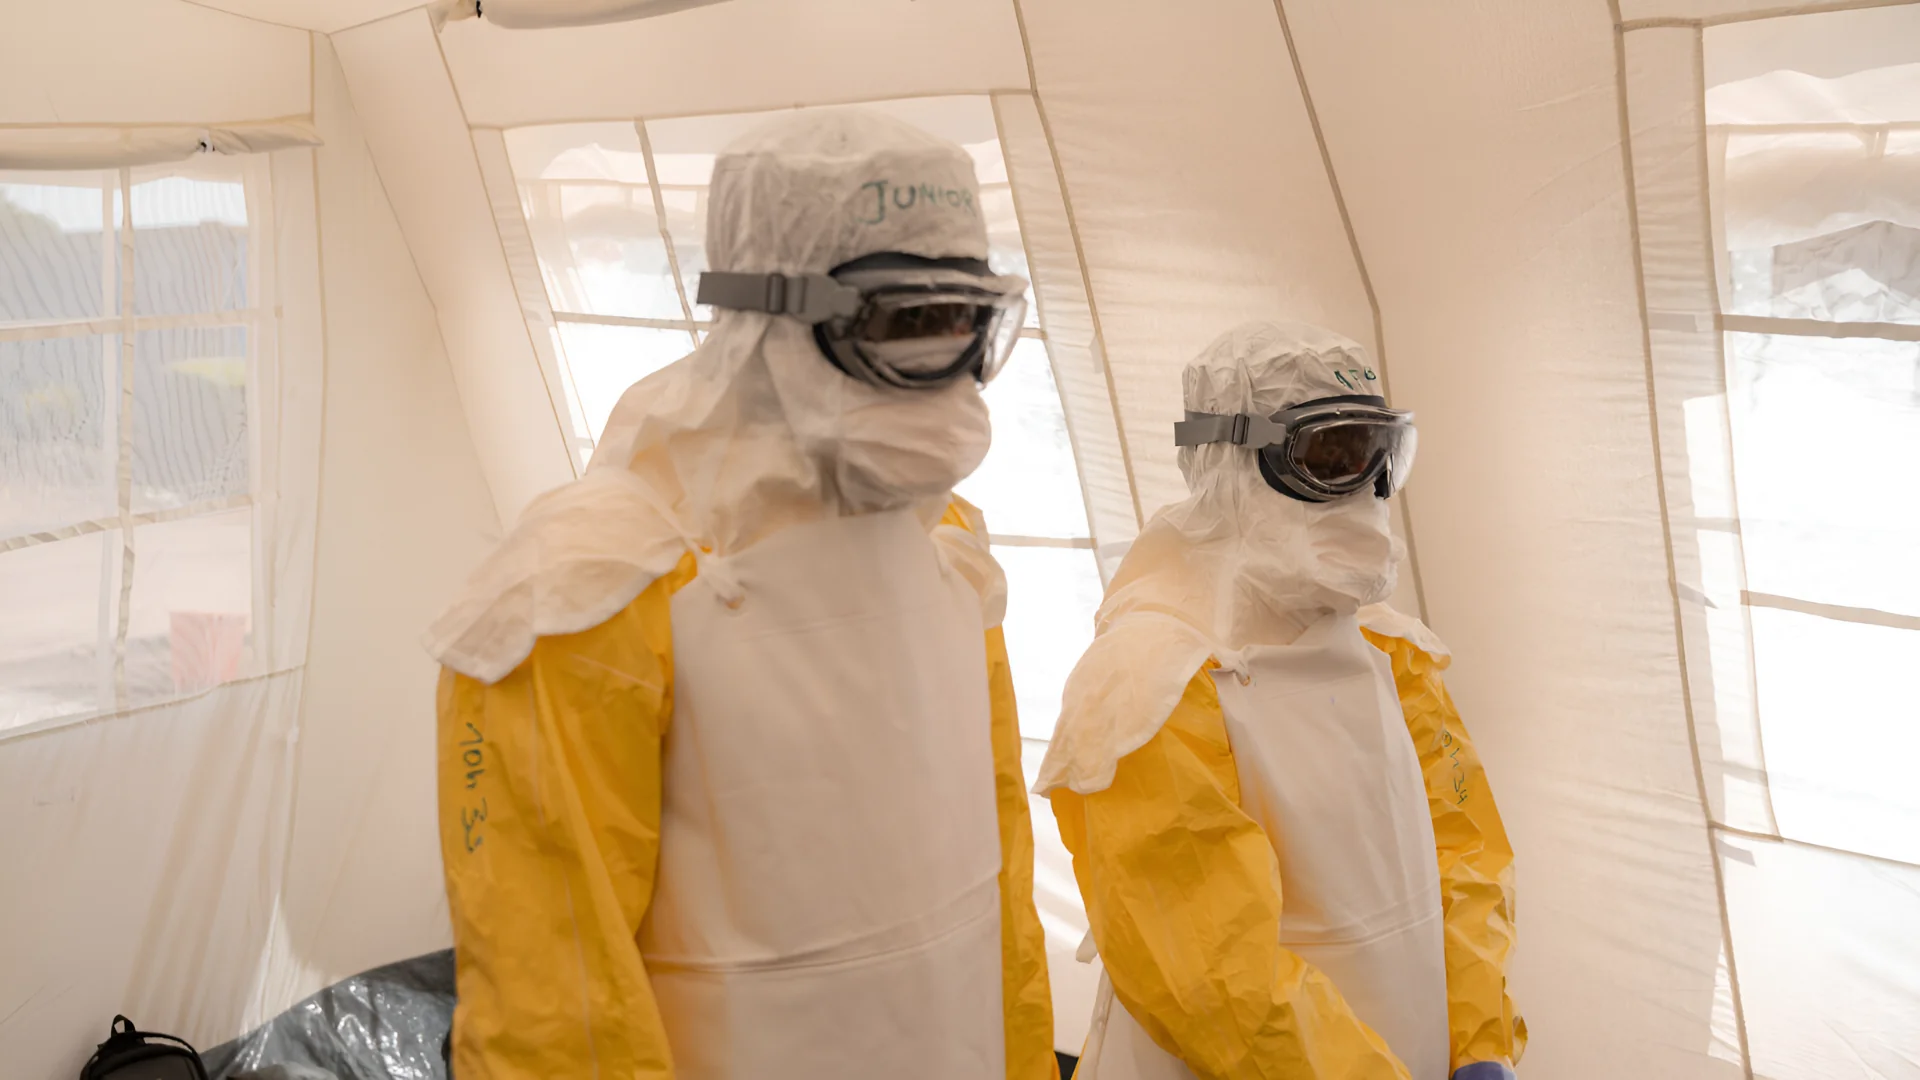
As of mid-June 2026, a rare Bundibugyo Ebola outbreak in DRC's Ituri Province has killed 138 people, spread to Uganda, and reached packed displacement camps with no licensed medical countermeasures available.

Daraxonrasib Nearly Doubles Pancreatic Cancer Survival
Trial results presented at ASCO 2026 show daraxonrasib nearly doubled median survival in advanced pancreatic cancer — a look at the data, the mechanism, and what remains unproven.
Comments (0)
Please sign in to join the discussion.
No comments yet.
Be the first to share your perspective on this topic.