

Every Go program allocates memory it eventually stops using. Something has to find that unused memory and give it back — without freezing the program to do it. That "something" is Go's garbage collector, and the way it avoids freezing anything is worth understanding in detail.
Why Go's Garbage Collector Barely Touches the Brakes
Think of your program's memory like a warehouse that stays open for business. A traditional garbage collector locks the doors, walks every aisle, throws out what nobody needs, and reopens — customers wait outside the whole time. Go's collector instead sends a worker to tidy shelves while customers keep shopping around them.
The trick is a bookkeeping system with three labels: white, gray, and black. Every object on the heap starts white, meaning "not yet checked." When the collector finds a live reference to an object — reachable from a running goroutine's stack or a global variable — it relabels that object gray, meaning "found, but I haven't looked at what it points to yet." Once the collector inspects everything that gray object points to, it becomes black: fully accounted for. Anything still white when the sweep begins is genuinely unreachable and gets reclaimed. The rule that keeps this safe while the program keeps running is simple to state: a black object may never point directly at a white one without a gray object in between. A small mechanism called a write barrier enforces that rule every time your code stores a pointer, which is what lets marking happen concurrently instead of during a full pause.
The Two Freezes Go Still Can't Avoid — and Why They Shrank 300-Fold
Concurrent marking doesn't mean zero pauses. Two brief stop-the-world moments still happen every cycle: one to flip the write barrier on before marking starts, and one to flip it off once marking is done. Neither one scales with heap size anymore, which is the part that took years to get right.
Early Go releases paused the whole program for the entire mark-and-sweep pass, and a 2018 retrospective from the Go team put worst-case pauses on large heaps around 300 milliseconds before Go 1.5. Go 1.5, in 2015, introduced the concurrent collector described above and cut extreme cases to roughly 4 milliseconds — already a two-orders-of-magnitude improvement. The last big jump came in March 2017 with Go 1.8, which eliminated a stop-the-world pass that had been re-scanning goroutine stacks at the end of each cycle. That single change pushed worst-case pauses into the sub-millisecond range, where they've stayed since.
Green Tea Trades Pointer-Chasing for Reading Memory in Order
Sub-millisecond pauses solved the "does it freeze" problem. They didn't solve the "how much CPU does it cost" problem — and that's what Go 1.25 and 1.26 target. The original marker is object-centric: it follows pointers wherever they lead, which on a large heap means jumping to essentially random memory addresses. A summary of the Go team's GopherCon 2025 talk put a number on the cost of that randomness — more than a third of scanning time was spent stalled, waiting for memory to arrive from RAM rather than actually doing useful work, because modern CPUs are fast but memory latency hasn't kept pace.
Green Tea, the collector introduced experimentally in Go 1.25 and made the default in Go 1.26, changes the unit of work from "one object" to "one memory page." It marks and sweeps whole spans of memory at a time, which means the scanner reads memory in the order it's laid out rather than hopping around unpredictably — friendlier to CPU caches, and on newer x86 chips, eligible for vectorized instructions that process many bytes per cycle. The Go team's own numbers describe many workloads spending meaningfully less time in GC, with some workloads seeing much larger reductions, and no application code changes are required to get it — as confirmed in the Go 1.26 release notes, where Green Tea switched from opt-in to default.
That said, gains aren't universal, and a careful reader should know that. An independent benchmark run against the Go 1.25 experimental build found close to no improvement on its workload, and in some runs GC cycles ran less often but cost more CPU each time they did run — a pattern later coverage says the Go team addressed before shipping Green Tea as the default in Go 1.26. The practical takeaway for an architect: treat the published 10–40% figure as a range shaped by your allocation pattern, not a guarantee, and benchmark your own service before and after upgrading.
Two Dials Every Go Service Should Know: GOGC and GOMEMLIMIT
None of this mechanism is something you configure directly — but two settings control when it kicks in, and they do different jobs. GOGC sets a target: the collector aims to run a cycle before the heap grows past a given percentage over the live-memory size measured at the end of the last cycle. The default, 100, roughly means "let the heap double before collecting again," trading some memory for less CPU spent on GC; lowering it collects more often and uses less memory but more CPU.
GOMEMLIMIT, added in Go 1.19, is a different lever: a soft ceiling on total runtime memory, useful when a container has a hard memory limit and an out-of-memory kill is the failure mode you're trying to avoid. The two are meant to work together — Go's own tuning guide describes GOMEMLIMIT as a safety net layered on top of GOGC's normal pacing, not a replacement for it. One caveat worth knowing before you set GOMEMLIMIT and walk away: if a program's actual live memory alone gets close to that limit, the collector can end up running almost continuously, burning a meaningful share of available CPU just to stay under the ceiling — GOMEMLIMIT caps memory, it doesn't fix an allocation-heavy program.
Put together, the last decade of this collector's history is a story of removing accidental O(heap size) work — first from pauses, now from cache behavior — while leaving the two knobs an operator actually touches essentially unchanged.

How Figma Uses WebAssembly to Render Complex Canvas at 60 FPS
Figma's C++ renderer compiles to WebAssembly, skipping JS garbage collection to hold 60 FPS — the full architecture from Emscripten to WebGPU, explained.

keyv and cacheable npm Packages Compromised in Supply Chain Worm
Attackers compromised keyv's maintainer account on Aug 4, 2026, publishing a credential-stealing npm worm that spread to 434+ packages and 1,381 versions.
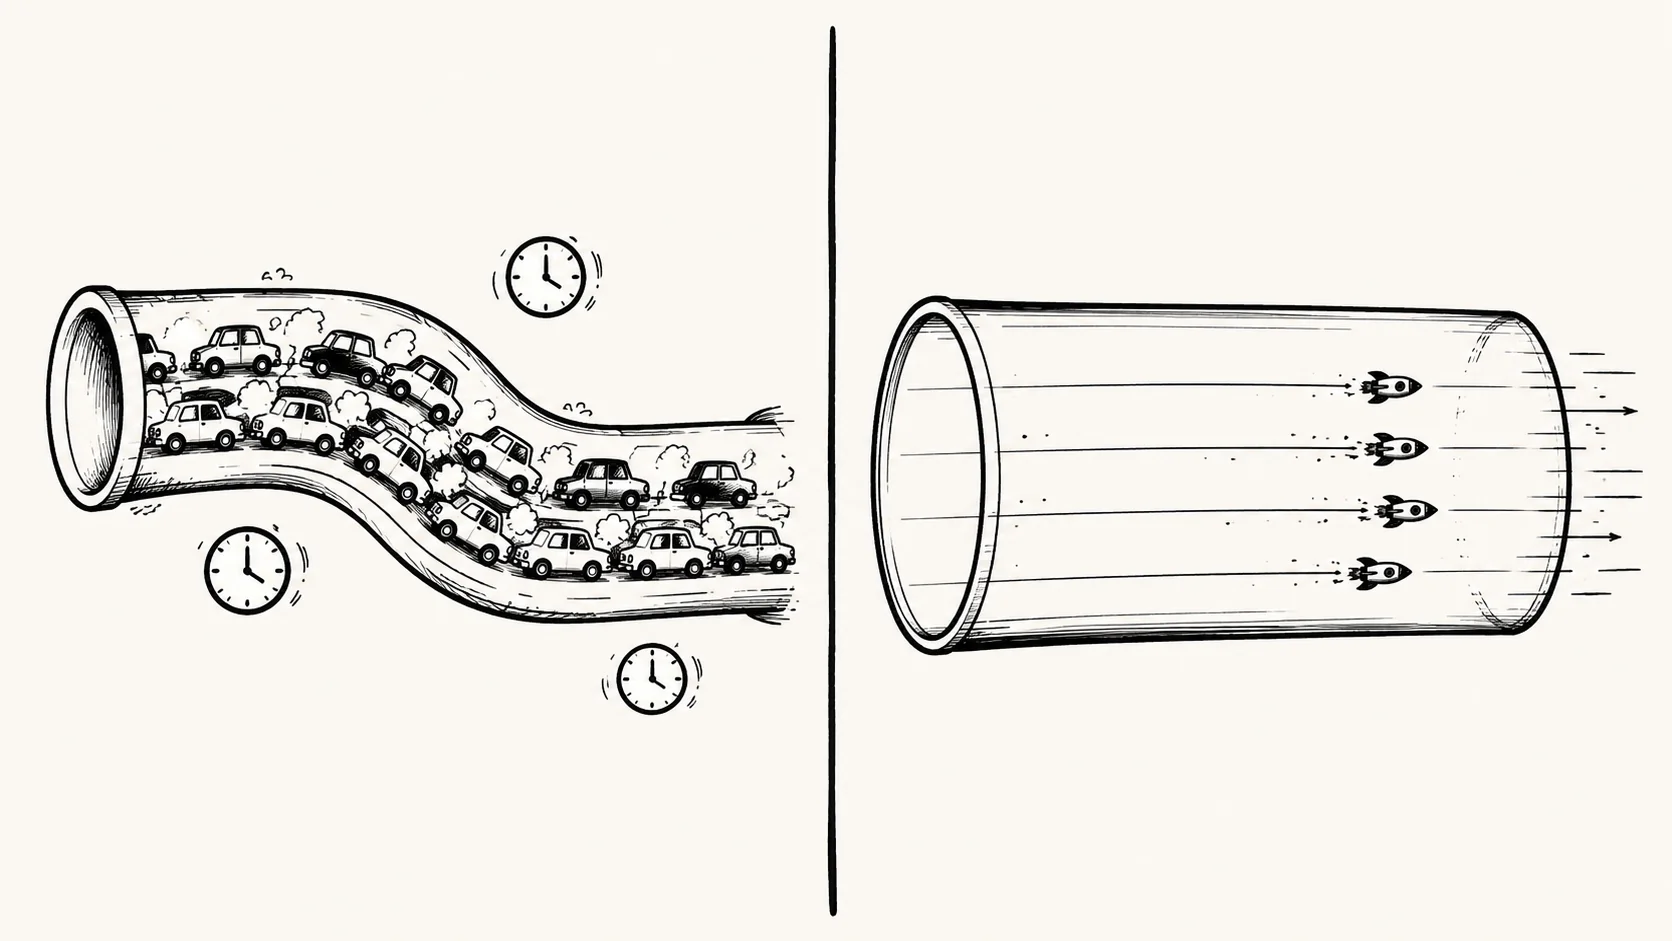
Why We Replaced REST with gRPC for Internal Microservices
gRPC vs REST benchmarks, isolated: Protobuf shrinks payloads and speeds serialization, but most of the latency drop traces to HTTP/2, not the encoding format.

The Ultimate Tech Stack for SaaS Startups in 2026, Explained Simply
Frontend to monitoring — a 2026 SaaS stack checked against vendor docs, with corrections logged where earlier claims didn't hold up.
Comments (0)
Please sign in to join the discussion.
No comments yet.
Be the first to share your perspective on this topic.