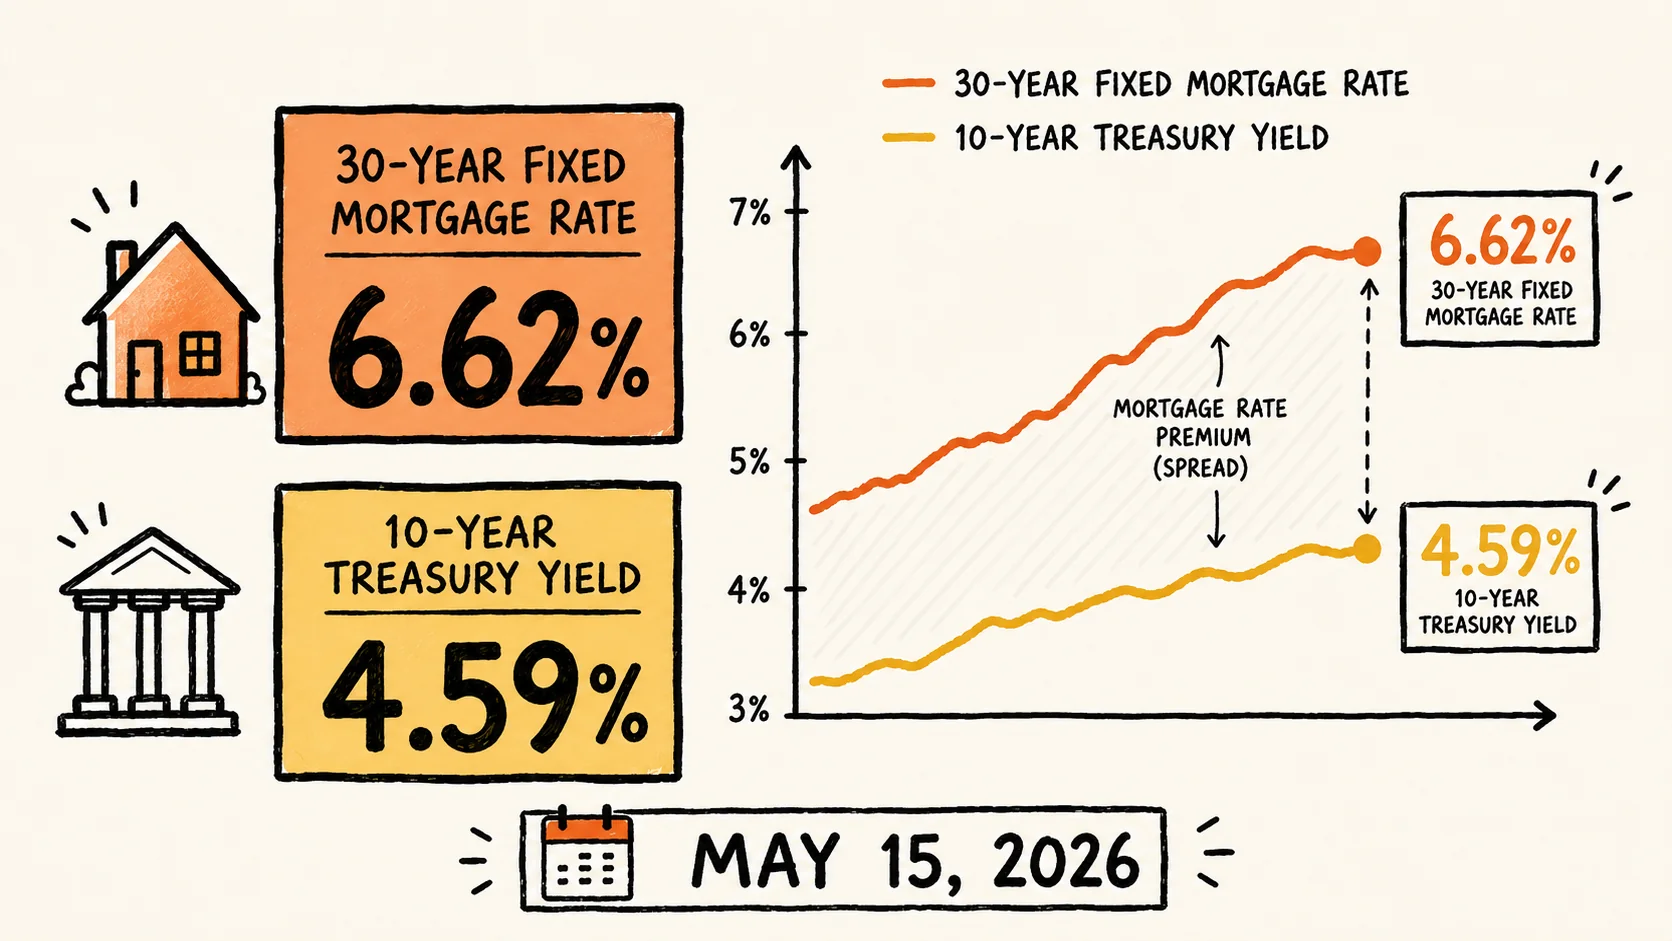
The average top-tier 30-year fixed purchase mortgage rate reached 6.62% on May 15, 2026 — the highest reading since August 1, 2025, according to Mortgage News Daily — as the 10-year U.S. Treasury yield touched 4.59% and April consumer price inflation held at 3.8% year-over-year.
Four Numbers Defining the Rate Environment on May 15
The rate environment on Friday, May 15 was shaped by a cluster of simultaneous pressures rather than any single catalyst. Mortgage News Daily's top-tier 30-year fixed purchase rate settled at 6.62%, matching levels last seen on March 26–27, 2026, and reaching the highest average since early August 2025. The 10-year Treasury yield, which serves as the primary benchmark that lenders use to price mortgage products, touched 4.59% in early afternoon trading — its highest point in a year.
On the refinance side, the picture was mixed in ways that require careful reading. Norada Real Estate's daily tracking showed the 30-year fixed refinance rate dipping six basis points from Thursday's close to 6.62%, and the 15-year fixed refinance rate falling three basis points to 5.73%. The 5-year adjustable-rate mortgage refinance rate, however, moved in the opposite direction, rising eight basis points to 7.25%. That day-over-day refinance dip is a product-level technical fluctuation at Thursday's close, not a structural reversal; the broader weekly and monthly trajectory, as Real Estate News and Mortgage News Daily both noted, remains sharply elevated relative to prior months.
Underlying all of it: April's consumer price index came in at 3.8% year-over-year — above any level the Federal Reserve has publicly described as consistent with its 2% target. Wage growth continues to lag that figure, meaning consumer purchasing power is contracting in real terms. Wall Street futures markets currently price a 50% probability that the federal funds rate will finish 2026 higher than its current level, according to Fortune's rate coverage — a futures-derived estimate that could shift materially with any incoming inflation print or employment report. The chart below shows the four headline numbers from Friday's market session.
Why Rates Aren't Already at 7%: The Fannie Mae and Freddie Mac Cushion
In ordinary market conditions, there is roughly a 150-to-200-basis-point spread between the 10-year Treasury yield and the 30-year fixed mortgage rate. With the 10-year yield at 4.59% on Friday, that historical spread would put mortgage rates somewhere between 6.1% and 6.8% — and in periods of acute investor stress, the spread can widen further, pushing rates toward or past 7%.
The reason rates are sitting at the lower end of that implied range, rather than pressing 7%, is a deliberate and significant intervention by Fannie Mae and Freddie Mac. The two government-sponsored enterprises have substantially ramped up their purchases of mortgage-backed securities in recent weeks, which compresses the spread between Treasury yields and mortgage rates by creating consistent additional demand for mortgage debt. Matthew Graham, chief operating officer at Mortgage News Daily, described the dynamic directly: "The more mortgage debt they buy, the better it is for mortgage rates relative to benchmarks like U.S. Treasuries."
This cushion is real but not unlimited. It means borrowers are currently protected from the full impact of the Treasury yield spike, but it also means the rate floor is being artificially supported by policy-linked purchasing activity rather than by underlying market equilibrium. If that purchasing activity were to slow, or if Treasury yields climbed further — as geopolitical risks suggest they could — the 7% threshold would become more plausible. The chart below illustrates the spread mechanics: where rates would sit without GSE intervention versus where they actually landed on May 15.
What Three Geopolitical Catalysts Did to Bond Markets on Friday
The bond market deterioration on May 15 was not a slow drift. It accelerated when President Trump boarded his return flight from a two-day summit in China with President Xi Jinping. Investors had entered the week hoping the meeting might produce signals of reduced global tension. The absence of any concrete breakthrough triggered a sell-off in U.S. Treasury bonds, pushing yields upward — and with them, mortgage rates.
That sell-off landed in a market already under pressure from two separate directions. First, a 12-week-old military conflict involving Iran has been a sustained driver of energy price increases. Oil prices ticked up again on Friday afternoon, which carries a direct inflationary consequence: higher energy costs feed into consumer price readings, reducing the likelihood that the Federal Reserve can pivot to rate cuts. Second, the April CPI reading of 3.8% — released earlier in the week — had already established that inflation was not decelerating toward the Fed's target. Major U.S. stock indexes fell roughly 1% on Friday afternoon as bond yields climbed and the persistence of that inflation picture became clearer to equity markets.
For perspective on the jobs and labor picture informing the Fed's posture, the April 2026 jobs report and its implications for Fed policy provides additional context, as does the April 2026 PPI surge, which showed producer prices rising at the fastest pace since 2022. Together, these readings reinforce why market-implied odds of a 2026 rate increase, rather than a cut, are now at 50%. The chart below maps the three geopolitical and macro catalysts and their transmission path into mortgage rates.
Who Can Actually Benefit From Refinancing at 6.62%
The 83% of current U.S. homeowners who hold mortgages with rates below 3% — secured during the pandemic-era low rate environment — have almost no financial incentive to refinance at today's 6.62%. Doing so would more than double their interest rate and sharply increase monthly payments. That cohort is largely locked in place, which is a primary reason housing inventory has remained constrained: selling requires buying, and buying now means giving up a sub-3% mortgage.
For two narrower groups, however, refinancing is mathematically defensible. The first is borrowers who purchased at peak rates above 7.5% — primarily in 2023 — who can now access rates in the mid-to-high 5% range on certain products, representing a meaningful payment reduction. The second is homeowners carrying high-interest revolving debt — credit card balances at 20% or above — who can consolidate that debt via a cash-out refinance at roughly 6.5%, still producing net interest savings.
In both cases, the break-even calculation requires accounting for closing costs. Current closing costs run between 2% and 6% of the total loan principal, which translates to between $6,000 and $18,000 on a standard $300,000 mortgage. A borrower needs to remain in the property long enough for monthly payment savings to fully recover that upfront outlay before the refinance becomes profitable. Separately, because traditional refinancing forces homeowners to surrender their existing rate and take on a new loan, many are instead turning to home equity lines of credit. Kyle Bass, production business manager at Refi.com, described the shift: "Home price growth has expanded borrowing capacity for existing homeowners. As refinancing became less attractive, HELOCs emerged as a flexible alternative." The chart below maps the three distinct borrower cohorts and their 2026 position.
Despite the rate pressure, pending home sales and overall loan activity have nudged upward over recent weeks, according to reporting from Real Estate News — a signal that some buyers are beginning to treat the 6% range as the new normal rather than waiting for a return to pandemic-era rates that may not materialize. Whether that normalization continues will depend heavily on whether the three macro pressures driving Friday's move — unresolved diplomacy, a still-active conflict in the Middle East, and inflation running nearly double the Fed's target — show any sign of easing before the summer homebuying season peaks.

Asia’s Youth Job Squeeze: Inside China’s Record Graduate Influx and Vietnam’s AI Skills Gap
China's record 12.7 million graduates face a 15.6% youth jobless rate as AI reshapes hiring; Vietnam shows the same skills-gap pattern at smaller scale.

CoreWeave and Nebius Are Chasing $145 Billion in AI Deals on $16 Billion of Revenue
Microsoft, Meta and Nvidia have committed more than $145 billion to neoclouds CoreWeave and Nebius, whose combined 2026 revenue is projected near $16 billion.

China's Gig Workforce Set to Hit 320 Million in 2026
China's flexible workforce is projected to reach 320 million in 2026. Wages are splitting by sector, and most workers remain outside the welfare system.

Stablecoins Hit $300B, But Are They Really Money?
Dollar stablecoins now total $300 billion, yet contract terms, custody structure, and unresolved settlement law leave most retail holders as unsecured creditors, not depositors.
Comments (0)
Please sign in to join the discussion.
No comments yet.
Be the first to share your perspective on this topic.