
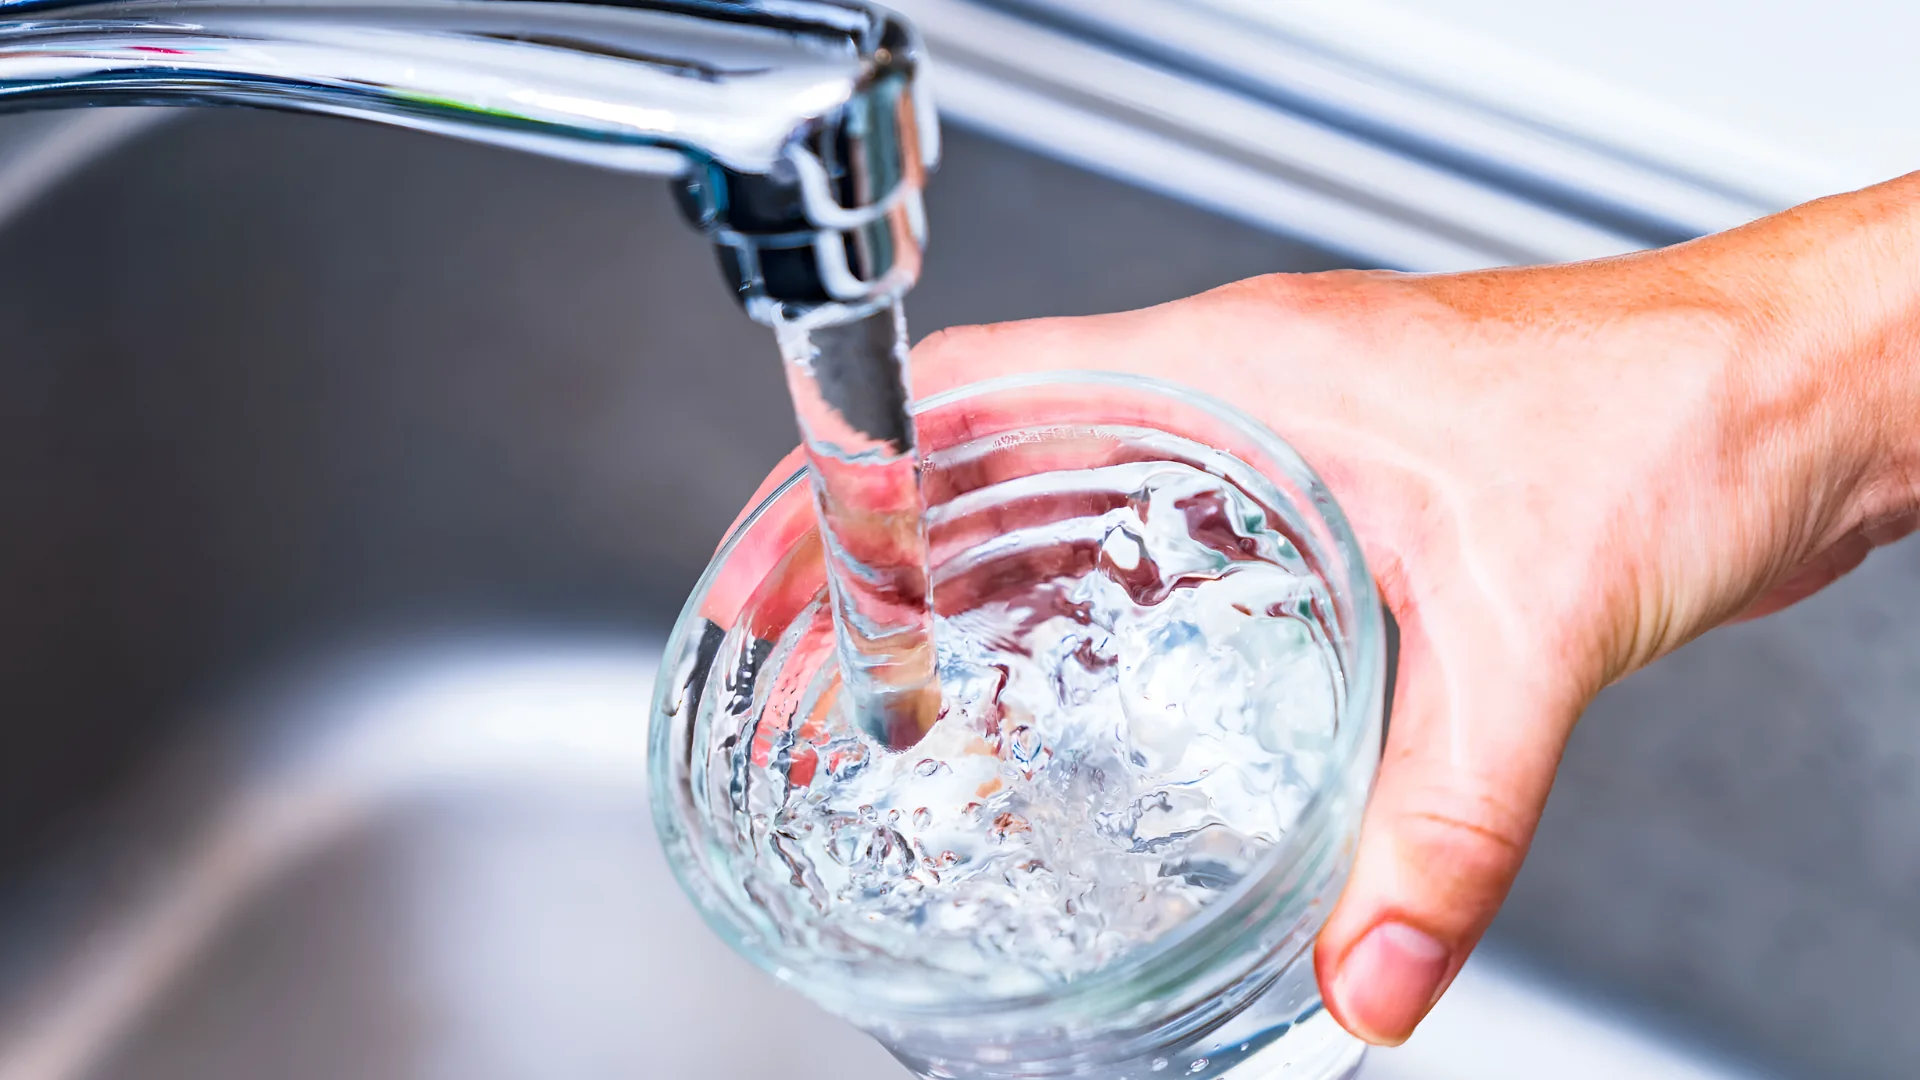
New research from Ohio State University found that bottled water carries roughly three times more nanoplastic particles than treated tap water. The catch: nearly half of U.S. tap water supplies contain detectable levels of PFAS, the synthetic compounds linked to cancer, thyroid disease, and immune disruption. Both facts are well-supported. Neither cancels the other out.
Bottled Water's Plastic Load Comes Largely From Its Own Packaging
The Ohio State study, published in Science of The Total Environment in February 2026, used a combination of scanning electron microscopy and optical photothermal infrared spectroscopy — a pairing the researchers described as novel for this type of analysis — to detect plastic fragments down to nanoscale sizes. They tested water from four municipal treatment plants near Lake Erie and six commercial bottled water brands.
Bottled water samples contained three times as many nanoplastic particles as the treated tap water samples. More than half of all plastic particles detected across both source types were classified as nanoplastics rather than the larger microplastic fragments that earlier research had focused on. The primary source of plastics in bottled water, the researchers noted, was the commercial packaging itself — the bottles and caps.
The finding matters beyond the particle count. Nanoplastics are smaller than microplastics by definition, and because of that size difference, they are more capable of crossing biological barriers inside the human body. Lead researcher Megan Jamison Hart, a PhD candidate in environmental sciences at OSU, acknowledged that long-term health effects at these concentrations are not yet fully established, but said the precautionary logic still holds: the evidence indicates nanoplastics cause problems, and reducing exposure where possible is reasonable.
Senior author John Lenhart, a professor of environmental engineering at OSU, said the concentrations observed were higher than the team had anticipated, and that the inclusion of nanoplastic detection — rather than microplastics alone — was what drove that finding. The implication is that studies measuring only larger plastic fragments have been underestimating total plastic exposure from drinking water.
The origin of nanoplastics in treated tap water is not yet identified. The OSU team offered preliminary hypotheses — interior erosion of plastic pipes, filtration sieves, and pressurized transport infrastructure — but the study did not establish a confirmed source pathway.
Hart's practical guidance was direct: for a person choosing between tap and bottled water on an average day, drinking from the tap carries a lower nanoplastic load. The chart below shows the relative particle comparison as reported in the study.
PFAS Contamination Reaches Nearly Half of U.S. Tap Water Supplies
The case for choosing bottled water has traditionally rested on avoiding contaminants in municipal systems, and PFAS — per- and polyfluoroalkyl substances — represent the most widely documented concern. The CDC has reported that virtually all Americans have measurable PFAS levels in their blood. A U.S. Geological Survey estimate cited by NPR's environmental reporter Mara Hoplamazian on May 14, 2026, puts the share of tap water supplies containing one or more PFAS compounds at approximately 45 percent, across more than 30 identified variants.
PFAS are synthetic compounds engineered for their resistance to heat, water, and chemical degradation. That same stability makes them persistent in environmental and biological systems. Chronic exposure has been linked to cancers, high cholesterol, thyroid disease, and immune suppression. They do not break down naturally, which means contamination in a water source tends to accumulate rather than clear over time.
Federal regulation has been contested. The EPA previously established enforceable limits on PFAS in municipal drinking water, but as of mid-2026, proposals to roll back or revise those standards have introduced uncertainty for both utility operators and consumers who rely on compliance enforcement as a signal of safety. The regulatory picture remained unsettled at the time of the NPR broadcast.
The metric cards below place the PFAS exposure scope in context using CDC and USGS figures.
The Mitigation Options Each Come With a Different Residual Risk
Neither choosing tap nor choosing bottled water eliminates both categories of risk at once. Filtering tap water addresses the PFAS concern more directly, and the two most effective technologies are multi-stage activated carbon filtration and reverse osmosis systems certified for PFAS reduction.
Reverse osmosis is the more efficient of the two at stripping PFAS. But it introduces a separate complication: the plastic housings, membranes, and resin components in RO systems may shed nanoplastics into the filtered output. That potential is flagged in preliminary findings and public forum discussions cited in the source material. Controlled measurement of nanoplastic output from certified RO units has not yet been established at the level of the OSU tap/bottled comparison, so the relative scale of this risk is not yet quantified. What it does mean is that the same logic driving consumers away from bottled water — avoid plastic contact — applies, in attenuated form, to plastic-component filtration hardware.
The practical mitigation that addresses both concerns most directly is storing and serving filtered water in non-plastic containers. Stainless steel and borosilicate glass — particularly options with minimal or no plastic or silicone components — remove the secondary plastic-contact step after filtration. The trade-off for consumers is cost and convenience rather than safety.
One action that does not reduce risk in either direction is switching between tap and bottled water without filtration. That swap trades a lower nanoplastic load (tap) for a lower PFAS load (bottled) and does not address the underlying exposure; it only shifts its composition.
The matrix below maps each main consumer option against the two contaminant categories using ordinal editorial assessments drawn from the sourced evidence.
The OSU researchers have not proposed that tap water is uniformly safe. Their finding is narrower: on the specific question of nanoplastic particle load, treated municipal water is currently the lower-exposure option compared with commercially bottled water. PFAS contamination operates on a different axis entirely, varies by geography and utility, and requires different tools to address. Consumers in areas with confirmed PFAS detections in their municipal supply face a situation where neither unfiltered option removes both categories of risk, and where the most complete mitigation strategy involves filtration combined with non-plastic storage — a combination that is more effective than any single substitution.

Inside the Physics Self-Study Guide 600,000 People Have Used
Susan Rigetti's physics self-study guide pairs a 9-stage curriculum with named textbooks, as U.S. physics bachelor's degrees fell to 7,776 in 2023-24.


Dior Beats Chanel for Taylor Swift's Wedding Gown
Jonathan Anderson designed custom Dior couture for Taylor Swift and Travis Kelce's wedding, a high-stakes celebrity commission LVMH needed as it competes with Chanel in a slow luxury market.


Savory, High-Protein Snacks Are Replacing Sugar Bars
Sugary bars are losing ground to savory, protein-forward snacks as "functional indulgence" and whole-food ingredients reshape what health-conscious shoppers reach for.

Taylor Swift and Travis Kelce's Reported MSG Wedding: What the Sources Actually Show
A breakdown of what permits, security documents, and sourced reporting reveal about the reported Taylor Swift and Travis Kelce wedding at Madison Square Garden on July 3, 2026.
Comments (0)
Please sign in to join the discussion.
No comments yet.
Be the first to share your perspective on this topic.