
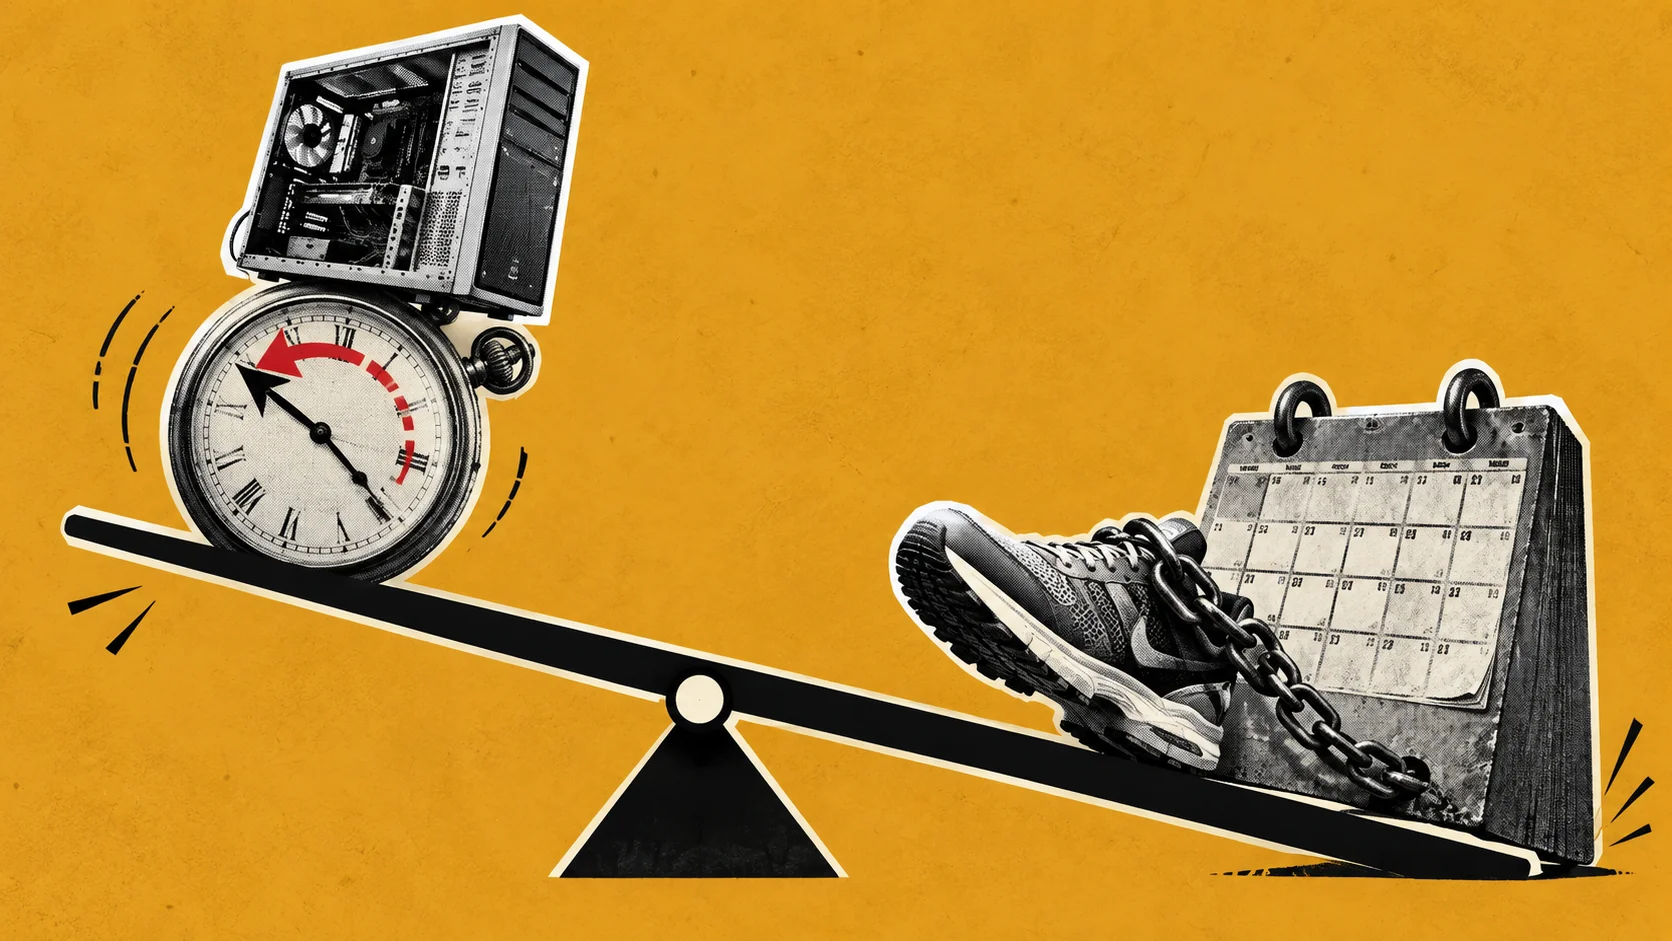
Dell's year-end balance sheet implies a cash conversion cycle of negative 36.7 days. Nike's implies positive 100.4 days. Both come from the same formula, and the 137-day gap between them traces mostly to two inputs: payable days account for about 85 of those days and inventory days for about 61.
Three day-counts decide the cycle: inventory, receivables and payables
The cash conversion cycle (CCC) counts the days between paying for inventory and collecting cash from the customer who bought it. The standard formula adds days inventory outstanding (DIO) to days sales outstanding (DSO) and subtracts days payable outstanding (DPO).
DIO = inventory ÷ cost of sales × 365
DSO = accounts receivable ÷ revenue × 365
DPO = accounts payable ÷ cost of sales × 365
CCC = DIO + DSO − DPO
Every figure below uses fiscal-year-end balances and full-year income statement totals, so each result can be rebuilt from a single filing. Averaging opening and closing balances is a common variant and shifts each result a little. The same guide recommends comparing a cycle against companies in the same industry and against the company's own trend.
A negative result means payable days exceed the sum of inventory and receivable days, so supplier credit covers the whole cycle and then some.
Dell's payables run 135 days against 98 days of inventory and receivables
Dell's fiscal-year-end statements show revenue of $113.5 billion, cost of net revenue of $90.8 billion, receivables of $17.6 billion, inventories of $10.4 billion and accounts payable of $33.6 billion at January 30, 2026. The table below also carries Nike's inputs, which the next section covers.
Day counts are BytePith calculations from the filed figures, using fiscal-year-end balances.
| Input (USD millions) | Dell, year ended Jan 30, 2026 | Nike, year ended May 31, 2026 |
|---|---|---|
| Revenue | 113,538 | 46,398 |
| Cost of sales | 90,831 | 26,487 |
| Accounts receivable | 17,585 | 5,931 |
| Inventories | 10,437 | 7,501 |
| Accounts payable | 33,630 | 3,600 |
| DSO (days) | 56.5 | 46.7 |
| DIO (days) | 41.9 | 103.4 |
| DPO (days) | 135.1 | 49.6 |
| Cash conversion cycle (days) | −36.7 | 100.4 |
| Payable days ÷ (DSO + DIO) | 1.37× | 0.33× |
Dell's payable days exceed its receivable and inventory days combined (98.5) by 36.7 days. In balance-sheet terms, payables of $33.6 billion exceed receivables plus inventories of $28.0 billion by $5.6 billion.
A year earlier the same calculation gives negative 30.0 days, built from a DSO of 39.3, a DIO of 33.0 and a DPO of 102.3. Over the year payables rose $12.8 billion while receivables rose $7.3 billion and inventories $3.7 billion, so supplier credit grew faster than the two assets it finances.
Nike's 103 inventory days exceed its entire 100-day cycle
Nike's results release reports revenue of $46.4 billion and cost of sales of $26.5 billion, with receivables of $5.9 billion, inventories of $7.5 billion and payables of $3.6 billion at May 31, 2026. That produces a DIO of 103.4 days, a DSO of 46.7 days and a DPO of 49.6 days.
Inventory days alone are longer than the cycle. Payables cover 49.6 days of the 150.0 days that inventory and receivables take to convert, so about two-thirds of that span is financed by something other than supplier credit.
Setting the two companies side by side, Nike's payable days are 85.5 shorter than Dell's and its inventory days 61.4 longer, while its quicker collection of receivables narrows the gap by 9.9 days. That pattern suggests the two would pull different levers: Nike through inventory, Dell through preserving supplier terms.
Benchmarks put payable coverage near 0.6 for both the U.S. and Europe
Hackett's survey of the 1,000 largest U.S. nonfinancial companies reported a cycle of 37 days and a DPO of 59 days, with the prior-year figure at 38.3 days. Hackett also estimated $1.7 trillion in excess working capital, of which receivables are the largest share at $600 billion, tied to an 18-day DSO gap between top-quartile and median companies.
The European edition covers the 1,000 largest European-headquartered nonfinancial companies and reports a cycle of 44.8 days, a DSO of 48.5, a DIO of 68.9 and a DPO of 72.6. The components reconcile: 48.5 plus 68.9 minus 72.6 equals 44.8. Hackett attributes the European deterioration to receivable and inventory days rising faster than payable days, with DIO at its highest level in a decade.
Dividing payable days by the other two components gives a coverage ratio. Europe's is 0.62. The U.S. release does not break out DSO and DIO, but adding its reported cycle to its reported DPO implies about 96 days of receivables plus inventory, a ratio near 0.61. Dell's 1.37 sits far above both and Nike's 0.33 far below. Two regions with cycles 8 days apart share almost the same coverage, which suggests the regional gap comes from longer receivable and inventory days in Europe (about 117 against 96) rather than from weaker payables.
The chart sets the three components side by side for Dell, Nike and the European benchmark, the one benchmark whose components all appear in the release.
Nike's tariff receivable shows how a year-end balance can distort the cycle
Nike's receivables rose 26% to $5.9 billion on flat revenue, which lifts DSO from 37.2 days a year earlier to 46.7. The release shows $986 million of expected tariff recoveries recognized in the fourth quarter and about $0.3 billion of cash received from them, and management said on the earnings call that the remainder was recorded to receivables. If roughly $0.7 billion of the balance is that claim, DSO would be near 41 days and the cycle near 95. That adjusted figure is a BytePith estimate from rounded inputs; the chart uses reported balances.
Dell's annual report describes the opposite exposure. It says large AI orders can require greater working capital commitments, and that payment terms with major component suppliers can differ from the terms its customers receive. Dell's negative cycle rests on a 135-day DPO, so payable days would have to fall below 98.5 for the cycle to turn positive at current receivable and inventory levels.
Loss Aversion Is About 2 on Average, and Near 1 for Small Stakes
The largest loss aversion meta-analysis puts the average coefficient at 1.955, below the textbook 2.25. See how stakes, task design and trading data shift it.
DeFi vs. TradFi: Where Cheaper Payment Rails Meet Different Liquidity Risks
DeFi vs TradFi compared: banks average 14.99% on $200 cross-border transfers, a stablecoin pilot priced 1.60% to 2.50%, and liquidity risk differs by design.

Why Credit Card Rates React to the Fed Faster Than Mortgages Do
How a central bank's overnight policy rate moves through prime rate, credit cards, mortgages and savings accounts at very different speeds.

Why Bonds Tokenize Easily and Real Estate Still Doesn't
Tokenized Treasuries top $13B on-chain; tokenized real estate stays under $250M combined. The reason: bonds were already digital, buildings never were.
Comments (0)
Please sign in to join the discussion.
No comments yet.
Be the first to share your perspective on this topic.