

In a 2024 study of twelve volunteers who drank only water for seven days, 1,044 of 2,923 measured plasma protein targets changed significantly. Only 54 had crossed the study's per-timepoint threshold by hour 48. A 2025 study of a different group, run on a different measurement platform, reports 49 proteins that moved significantly in both datasets with no conflicting directions, and adds blood and urine measures of inflammation and platelet activity.
Only 54 proteins had moved by hour 48
The Nature Metabolism study drew morning blood from 12 volunteers (five women, seven men) two days before the fast, daily during it, and three days after eating resumed. A team spanning Berlin, London, Cambridge and Oslo ran the 117 resulting samples on the Olink Explore platform. Participants lost 5.7 kg on average, and the authors report no severe adverse events in daily interviews.
Of the 2,923 protein targets, 1,044 (35.9%) changed significantly at a 5% false discovery rate, and 144 shifted by more than two standard deviations (SD) of their pre-fast variability, 122 of them downward. The timing is what stands out. Six targets passed the paper's stricter per-timepoint threshold at 24 hours and 54 at 48 hours, and the authors describe a systemic plasma response only from the third day. Three days after volunteers resumed eating, 66 proteins still differed from baseline.
The chart plots the six fasting responders for which the manuscript text gives both a peak day and a size.
Thyrotropin, the pituitary hormone that drives the thyroid, bottomed out on day 2 at 1.41 SD below baseline. The other five peaked on day 3 or later, and the three largest swings were follistatin (up 5.62 SD on day 3), NBL1 (down 5.20 SD on day 7) and PCSK9 (up 4.75 SD on day 7). The authors flag those three as candidate markers of fasts lasting three days or more. They read the lag as consistent with trials in which fasts of 48 hours or less showed no clear advantage over matched calorie cuts, a comparison their own design cannot test because it has no control group.
Tenascin-R and a matrix signature that may bear on lean mass loss
The fasting signature was strongly enriched for extracellular matrix proteins, the scaffold between cells (p < 3.6 × 10⁻⁷). Tenascin-R, a brain-specific matrix protein that helps anchor the perineuronal nets around synapses, was the most significant single protein in that group (beta −0.73, p < 2.4 × 10⁻³⁷). The authors speculate that fasting alters how neurons recycle tenascin-R; the study did not test this.
Matrix proteins tied to elastic fibres and the vessel wall also fell from day 2, which the authors suggest may reflect structural adaptation and could explain part of the lean mass loss. Lean mass dropped by 3.6 kg in that cohort. A separate 2025 study from the Oslo group, in a different cohort of 13 volunteers, measured 4.6 kg of lean mass lost over seven days. After six days of fasting, knee-extensor strength was unchanged and peak oxygen uptake was down 13%. Its authors note that collagen makes up 25 to 30% of the body's protein, so non-contractile protein can be lost without a drop in strength. Read together, the two papers allow a reading in which part of the lost lean mass is matrix rather than contractile tissue. Neither study measured that directly.
The 2025 SOMAScan cohort matches 49 proteins and adds inflammation markers
The Molecular Metabolism study followed 20 volunteers through a medically supervised water-only fast that averaged 9.8 days, then about five days of guided refeeding. It measured 1,317 proteins on the SOMAScan platform in 15 of them. By the end of the fast, 86 (6.6%) had changed, and only 12 remained altered after refeeding.
Two plasma proteome studies of water-only fasting, side by side
| Feature | Pietzner et al., 2024 | Commissati et al., 2025 |
|---|---|---|
| Participants | 12 (5 women, 7 men), described as generally healthy and young | 20 (11 women, 9 men), mean age 52.2 years, mean BMI 28.8; proteomics in 15 |
| Fast | 7 days, water only | 9.8 ± 3.1 days, water only, medically supervised |
| Platform and targets | Olink Explore, 2,923 targets | SOMAScan, 1,317 targets |
| Proteins changed | 1,044 (35.9%) at some point, 5% false discovery rate | 86 (6.6%) by end of fast, 74 down and 12 up |
| After eating resumed | 66 still different after 3 days | 12 still different after about 5 days |
| Shared at day 7 | 44 decreased and 5 increased in both datasets, with no conflicting direction (overlap as reported by the 2025 team) | — |
| Added measures | Genetic links for 212 changed proteins to about 500 outcomes | C-reactive protein up 129%, liver enzymes up about 64 to 65%, platelet-activation marker up 21% during the fast |
The 35.9% and 6.6% figures should not be read as a disagreement. They come from different platforms, panels of 2,923 and 1,317 targets, fasts of 7 and about 10 days, and statistical designs (change at any time point versus end of fast against baseline). The comparison that carries weight is the overlap: 49 proteins significantly altered in both datasets at day 7, with no study disagreeing on direction.
What the second cohort adds is a less comfortable set of measures. High-sensitivity C-reactive protein, a standard inflammation marker, rose 129% and returned to baseline after refeeding in all but one participant. The liver enzymes AST and ALT rose 65% and 64% and stayed elevated through refeeding. Urinary 11-dehydro-thromboxane B2, a marker of platelet activation, rose 21% during the fast and 36% after refeeding while platelet counts held steady. Headache, weakness, fatigue and low blood pressure on standing were common, one participant each had low potassium and an arrhythmia, and six moved to a broth or juice fast. The authors read the inflammatory response as a possibly transient adaptation that still raises cardiometabolic questions. Their declarations state that one author founded the fasting centre where volunteers were recruited, and that the study team operated independently of it.
Both datasets contain signals that lean toward clotting. The 2024 authors describe a possibly hypercoagulable state in an early-rising protein cluster and note that rising coagulation factor XI is genetically linked to thrombotic events. One is a genetic prediction and the other a urinary biomarker, so they are different kinds of evidence, but they point the same way.
The 2024 genetic mapping also points toward benefit in places. Genetic evidence ties higher SWAP70 to rheumatoid arthritis risk (posterior probability 99.1%), and SWAP70 fell by 1.5 SD by day 6. Higher genetically predicted HYOU1 is linked to coronary artery disease (odds ratio 2.02 per SD, 95% confidence interval 1.54 to 2.64), and fasting lowered it. For 652 of the genetically predicted protein and disease links (52.2%), the fasting response runs against the predicted adverse direction; for the rest it aligns with higher risk. The authors call the predictions exploratory and say fasting should not be read as a sole solution to the diseases shown.
No control group, and a 2026 follow-up that asks a different question
Neither proteome study had a control group. The 2024 cohort had 12 volunteers, all but one of white-European ancestry, and the 2025 cohort supplied proteomics for 15. Most protein changes in the 2024 data returned toward baseline once eating resumed, which the authors take to mean that any benefit would need sustained manipulation of the relevant targets. They call for large prospective trials. Within the 2024 cohort, 452 proteins tracked changes in the ketone 3-hydroxybutyrate and 49 tracked weight change, a correlation inside one uncontrolled group.
In July 2026 the same research group published a follow-up in Diabetologia: oral glucose tolerance tests in 11 volunteers before and after 7 days of complete caloric restriction. A signature of 44 proteins responded to glucose, reappeared after the fast, and was 20-fold enriched for stomach-specific proteins. It asks how the gut responds to sugar after a week without food, so it adds no new test of the day-3 signature.
No study cited here follows participants for weeks after refeeding, so the persistence of the day-3 signature and of the 2025 inflammation and platelet findings remains unmeasured.
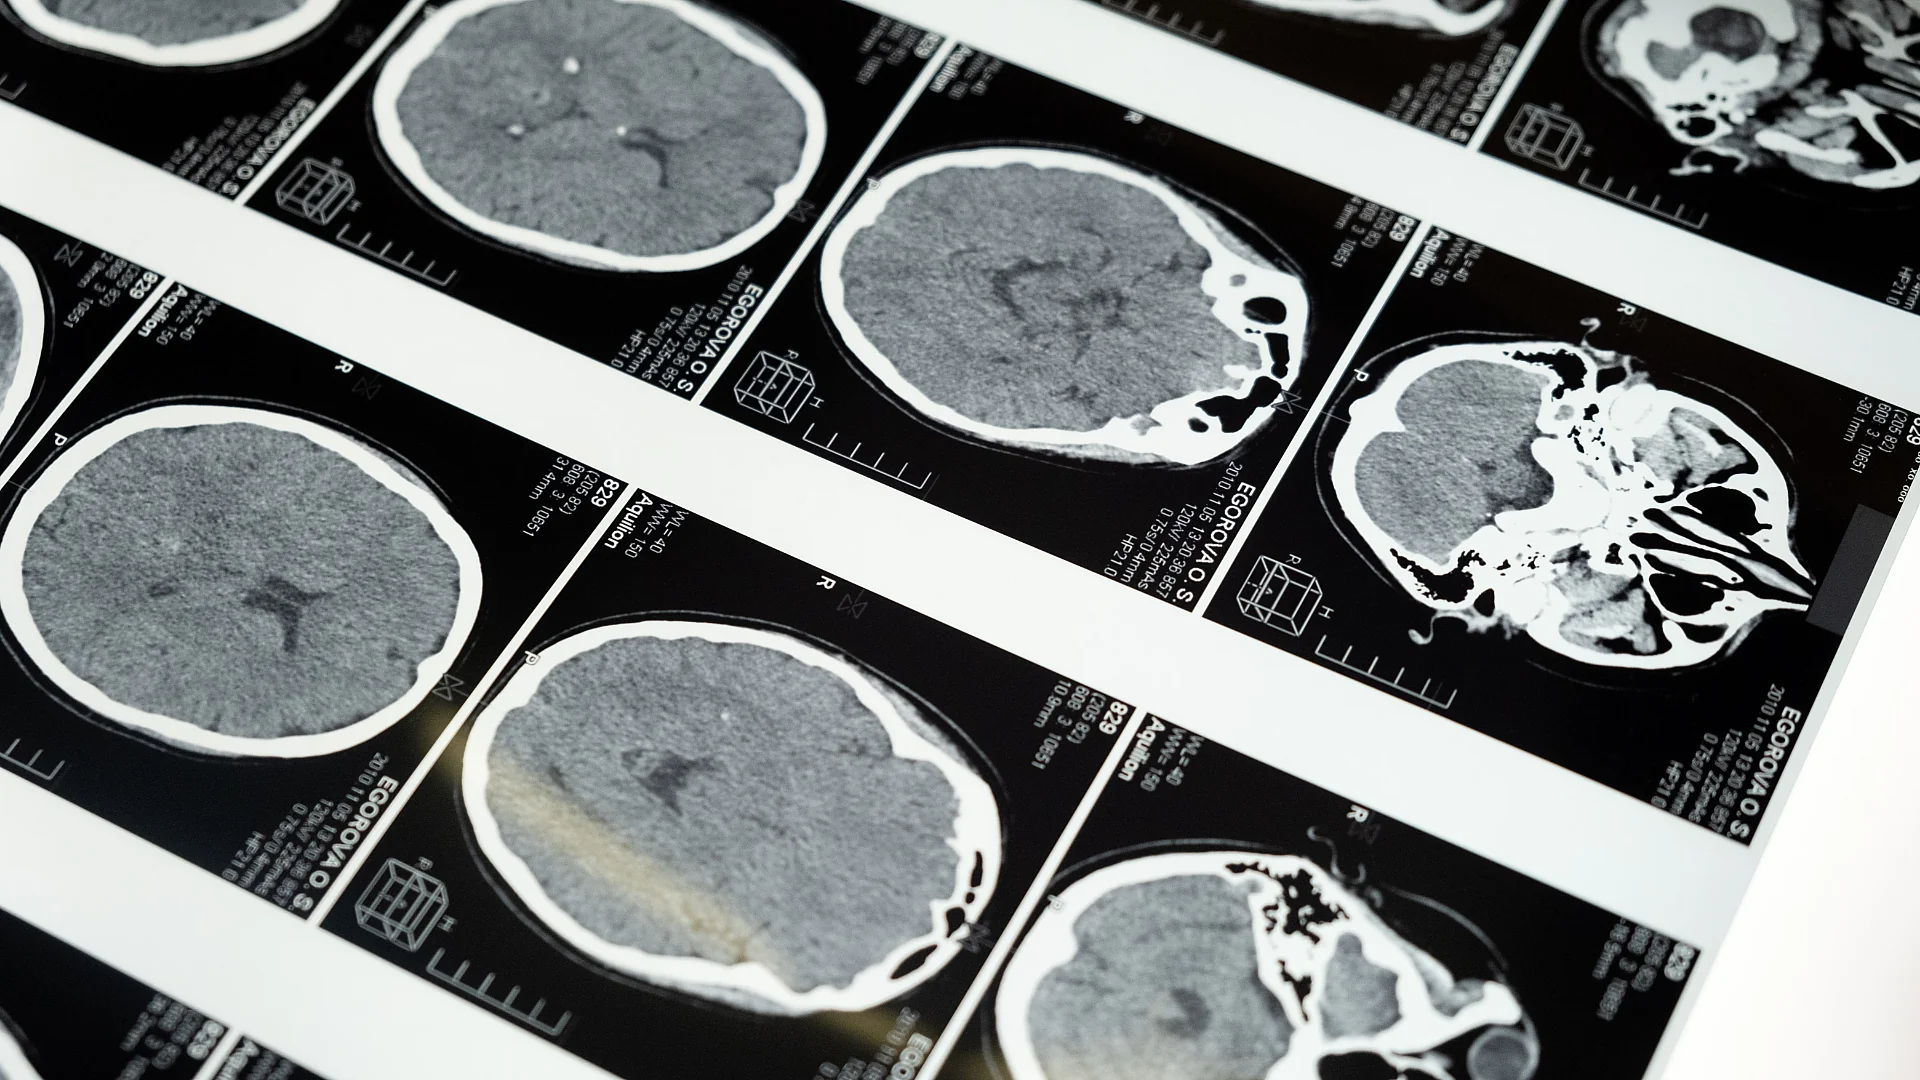
Five Candidate Depression Phenotypes Emerge From MEG Brain Oscillations
MEG depression phenotypes: 263 patients cluster into five oscillation profiles, yet brain–symptom links explain only 3–4% of shared variance in the cohort.
Paricalcitol and Pancreatic Cancer: Safety Data Published, Phase 2 Not Pursued
Paricalcitol plus gemcitabine and nab-paclitaxel in 36 patients: 42% of the oral arm had grade 2–4 hypercalcemia, and the registry says phase 2 was not pursued.

Mouse and Stem Cell Data Show the Brain Has Two Separate Origins
A Stanford lineage-tracing study finds two separate progenitor cells, marked by Otx2 and Gbx2, build the forebrain/midbrain and hindbrain from gastrulation.
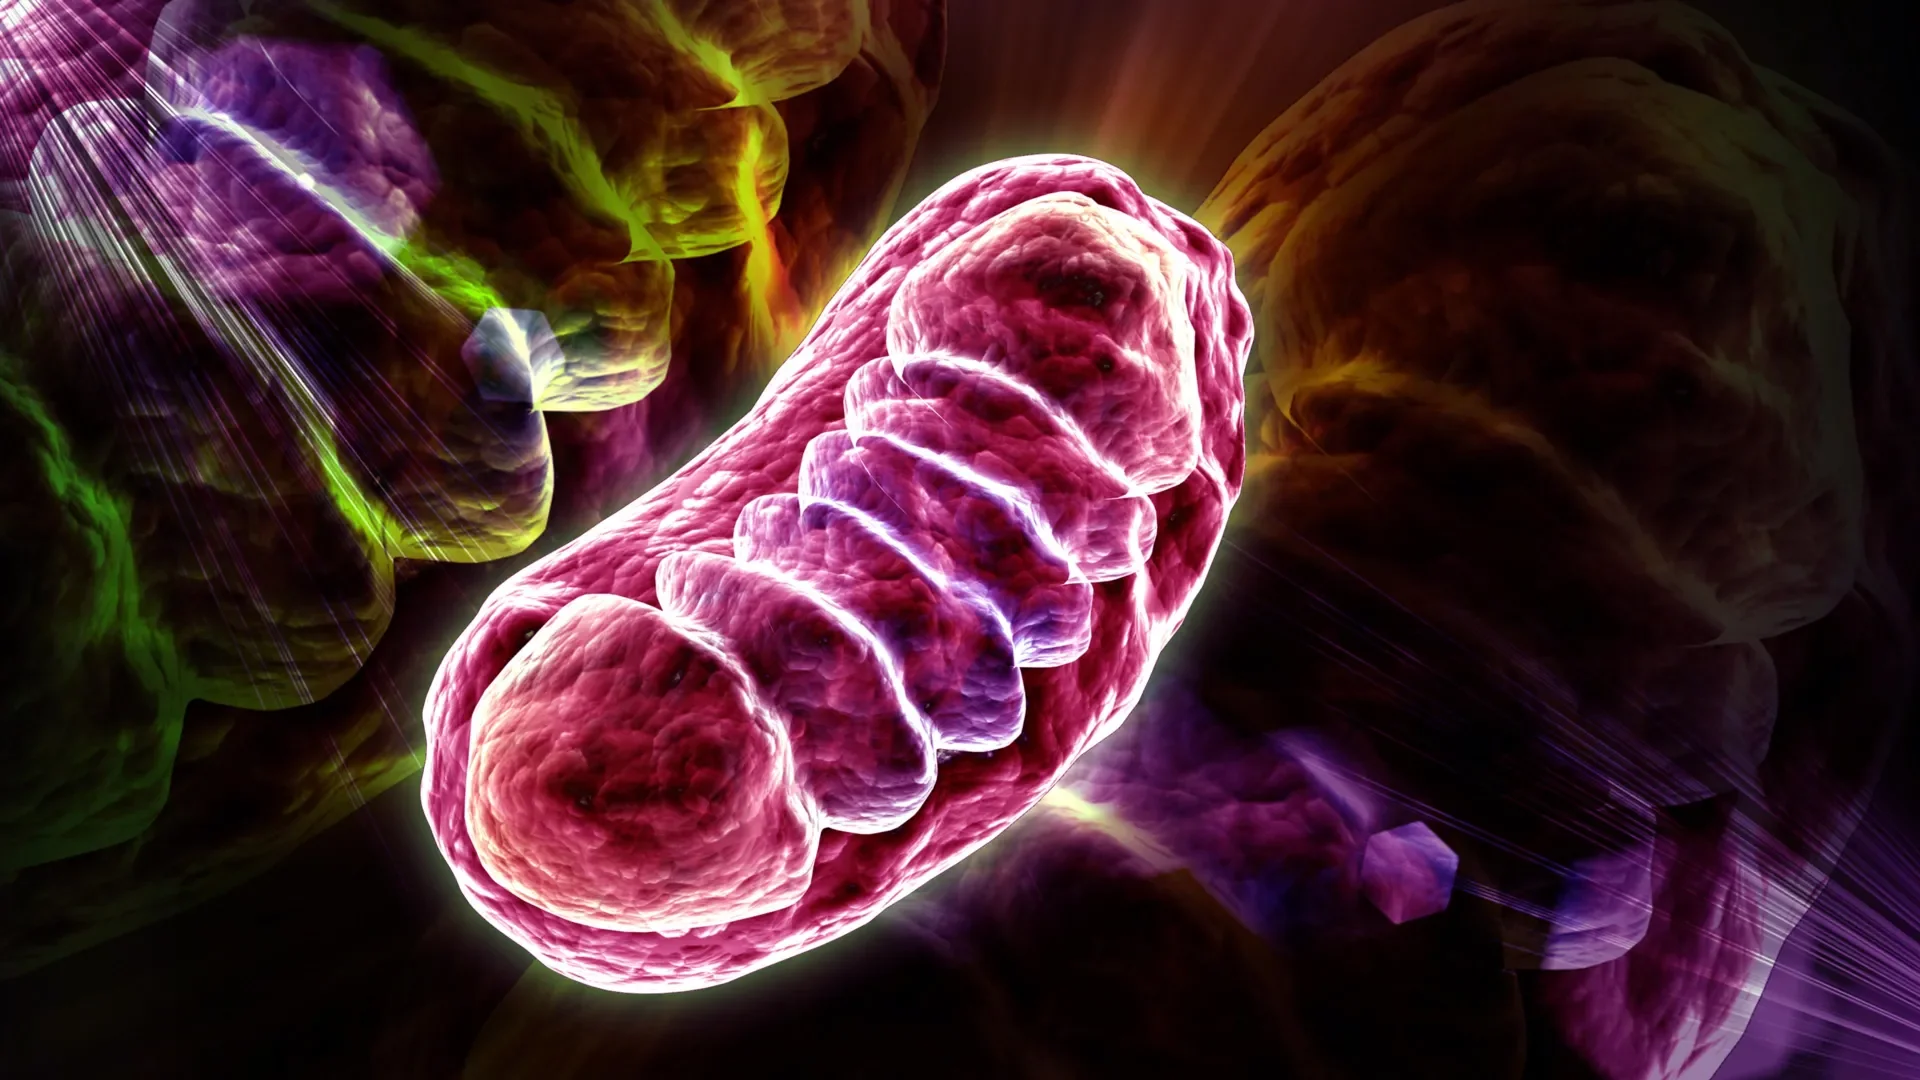
Mitochondria's Acetyl-CoA Switch Explains How 'Zombie' Cells Fuel Chronic Inflammation
Senescent 'zombie' cells use a mitochondrial acetyl-CoA switch to activate inflammatory SASP genes, and blocking it eased frailty in aged mice, Nature reports.
Comments (0)
Please sign in to join the discussion.
No comments yet.
Be the first to share your perspective on this topic.