
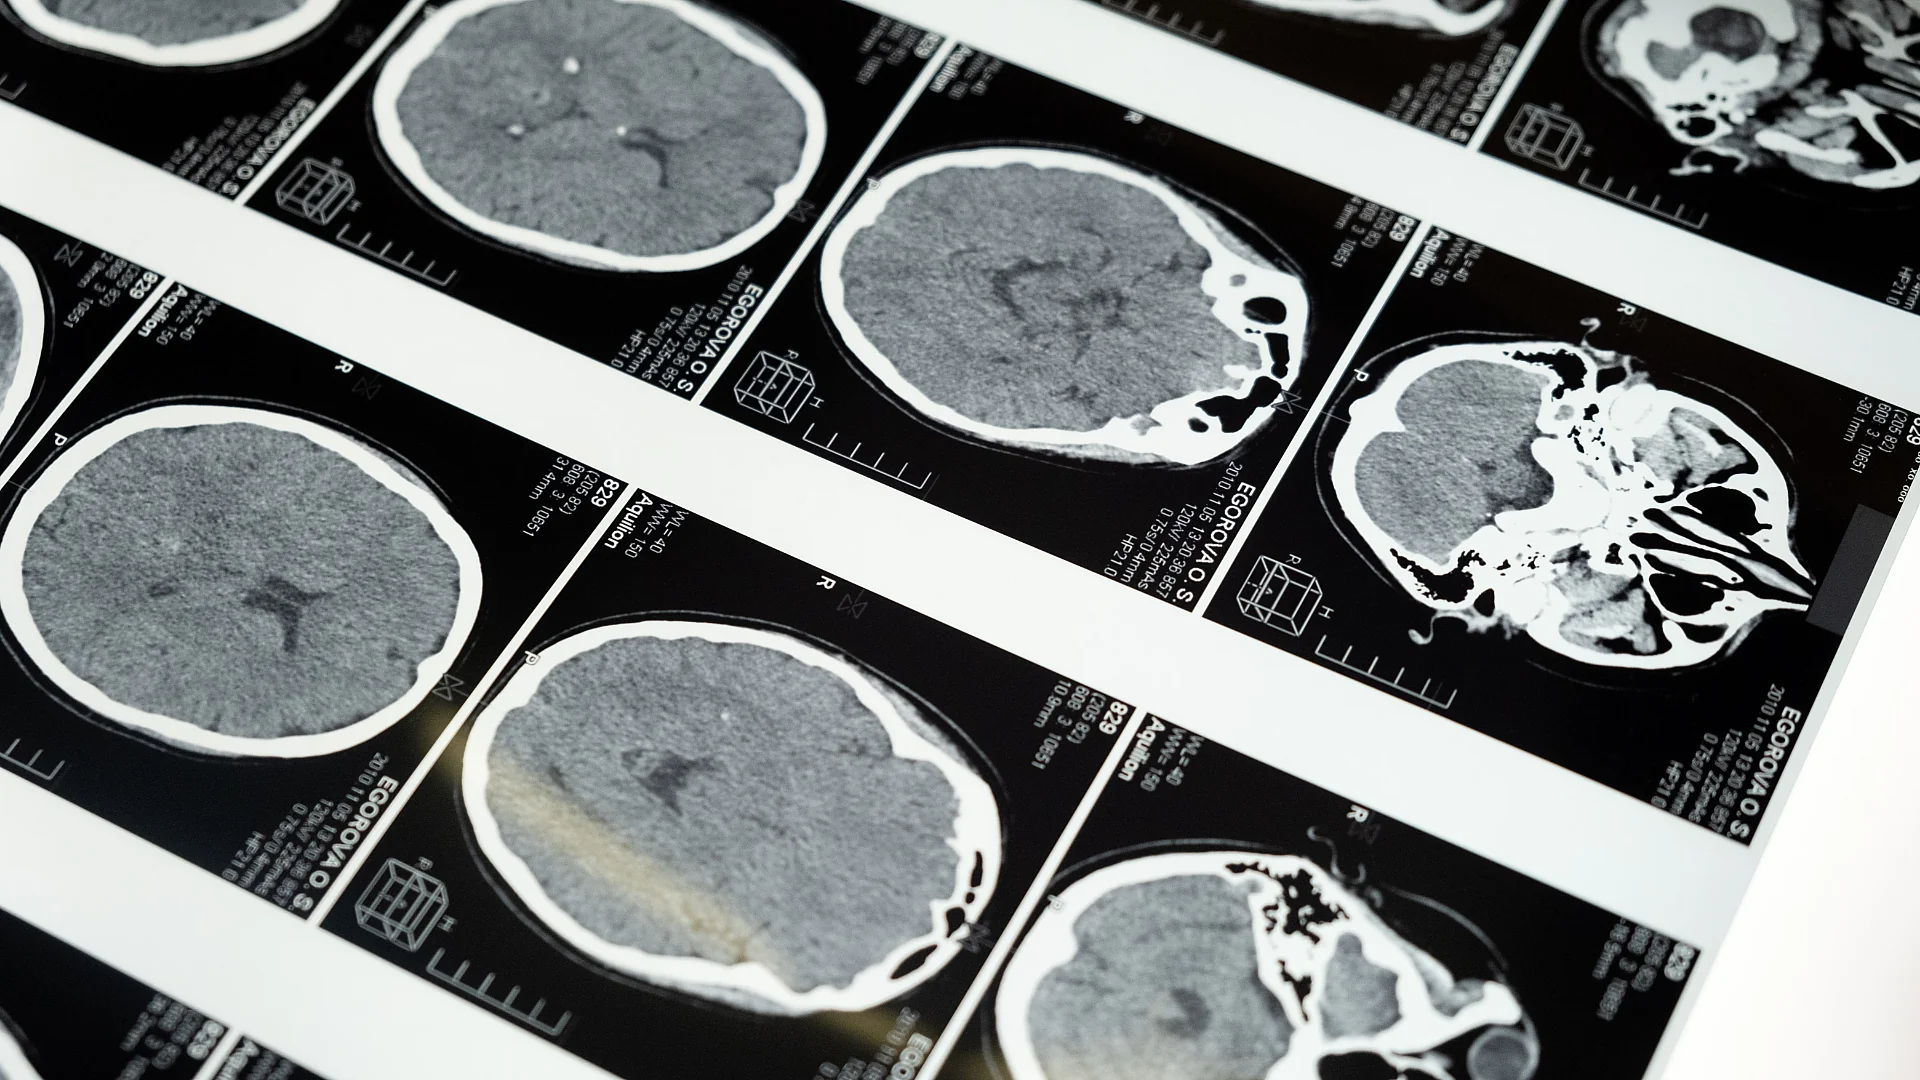
Whole-brain connectivity measured with magnetoencephalography (MEG) did not differ significantly between 263 patients with major depressive disorder (MDD) and 75 healthy volunteers, yet the same patients sorted into five clusters whose connectivity ran in opposite directions. The open-access study, published online on 31 August 2026 and carried in the October issue, ties those clusters to different symptom profiles. It reports no treatment outcomes, so the clusters remain candidates awaiting validation.
How 15 minutes of MEG became five clusters
Each participant completed 15 minutes of eyes-open resting MEG at one of two Finnish sites. The team reconstructed cortical activity from each person's MRI, grouped it into 200 parcels of the Schaefer atlas, and filtered it at 32 frequencies from about 2 to 60 Hz. For every pair of parcels they computed two coupling measures. Phase synchrony (wPLI) tracks how consistently two regions' rhythms line up in time. Amplitude correlation (oCC) tracks whether the strength of those rhythms rises and falls together. Both resist the false connections that signal leakage between neighbouring sources can create.
Each parcel's mean coupling to all others, called node strength, was then linked to ten self-report scales with partial least squares correlation (PLSC), after age and sex were regressed out. One latent component survived permutation testing for amplitude correlation (P = 0.0085) and one for phase synchrony (P = 0.0452). Leiden clustering on those two components produced the phenotypes. The diagram traces the pipeline with the counts the paper reports at each step.
The Methods condense to a few lines. This sketch is a summary of the published description, not the authors' code.
# for each of 32 frequencies and each pair (x, y) of the 200 parcels
wPLI = abs(mean(imag(S_xy))) / mean(abs(imag(S_xy)))   # phase synchrony
oCC  = corr(amp(x_orthogonalised_to_y), amp(y))        # amplitude correlation
NS_i = mean_j(coupling(i, j))                          # node strength per parcel
# PLSC: R = Y^T X, then singular value decomposition R = U D V^T
L_X, L_Y = X @ V, Y @ U                                # brain scores, symptom scores
# Leiden on similarity = 1 / (1 + distance), resolution 0.85
Opposite connectivity directions inside one diagnosis
At the cohort level the contrast was thin. Power spectra and whole-brain graph strength showed no significant MDD-versus-control differences for either coupling mode. Only parcel-level node strength differed: amplitude correlation was weaker in the delta band (2–4 Hz), phase synchrony was weaker at 4–5 Hz and 10–15 Hz, and delta-band phase synchrony was stronger.
The clusters separate by direction. Two phenotypes sat above controls, two sat below, and one mixed the pattern. The authors suggest that pooling patients with excessive and deficient connectivity could explain earlier reports of both higher and lower alpha-band connectivity in depression. A mean over opposing groups can land near the control value, which makes the idea plausible, although this study does not test it directly.
The next table arranges the authors' cluster descriptions side by side. QIDS and PHQ-9 measure depressive severity, GAD anxiety, RRS rumination, SDS functional impairment, PCL PTSD symptoms, PVSS positive-valence function (anhedonia), BEAQ experiential avoidance and ASSIST substance involvement. Frequencies are those where a cluster differed from controls, and symptom columns compare each cluster with the rest of the patients.
| Cluster | Amplitude correlation vs controls | Phase synchrony vs controls | Symptom scores vs other patients |
|---|---|---|---|
| 1 | Higher, 7–20 Hz | Higher, 7–9 and 18–22 Hz | Higher QIDS, GAD, RRS, SDS, PCL, PVSS (broad high-symptom group) |
| 2 | Lower, 5–10 Hz | Lower, 8–30 Hz | Lower on most scales, except RRS and BEAQ |
| 3 | Lower, 2–60 Hz | Lower, 6–30 Hz | Lower RRS and ASSIST; higher PCL and BEAQ |
| 4 | Lower, 2–8 Hz | Higher, 25–40 Hz | Higher PHQ-9, ASSIST and inverted WHO-5 (poorer well-being) |
| 5 | Higher, 2–60 Hz | Higher, 6–30 Hz | Higher ASSIST (substance use); lower PCL |
Peak alpha-band amplitude coupling sat at 9, 11, 11, 10 and 8 Hz across clusters 1 to 5. The authors link the two hyperconnected clusters to low alpha (8–9 Hz) and the two hypoconnected clusters to high alpha (11–12 Hz). They relate cluster 1's lower individual alpha frequency and heavier symptoms to earlier work tying lower alpha frequency to greater severity. They also read cluster 3, with weak connectivity and higher PTSD-checklist scores, as a sign that PTSD symptoms have distinct physiology, an interpretation that rests on a single cohort.
A 2017 fMRI benchmark and a 62% ceiling frame the claim
Two earlier studies set the comparison. A 2017 fMRI study of depression biotypes clustered patients (n = 1,188) into four biotypes, built classifiers with 82–93% sensitivity and specificity in two further datasets, and reported that the biotypes predicted response to transcranial magnetic stimulation in 154 patients. The MEG paper offers no equivalent treatment test. A 2024 evaluation of machine-learning biomarkers trained and tested 4 million models on 1,801 participants and found diagnostic accuracies between 48.1% and 62.0%. The MEG authors cite that evaluation as evidence that individual-level biomarkers have not generalised.
The 2024 task was diagnosis, separating patients from controls, while the MEG paper clusters people who already have the diagnosis. The two results therefore address different questions. Read together, they suggest that a single average signature of MDD is hard to find and that subgroup structure may be where any signal sits. That inference links three separately designed studies, and none compared the approaches on the same data.
| Study | Modality | Sample | Task | Reported result |
|---|---|---|---|---|
| MEG phenotypes, 2026 | Resting MEG | 263 MDD, 75 controls | Cluster patients with MDD | Five phenotypes; no treatment outcome |
| fMRI biotypes, 2017 | Resting fMRI | n = 1,188 | Cluster patients with depression | Four biotypes; 82–93% classifier sensitivity and specificity; rTMS response (n = 154) |
| ML biomarkers, 2024 | MRI, DTI, polygenic score | 1,801 | Classify MDD vs control | Accuracy 48.1% to 62.0% |
What a 3–4% brain–symptom link leaves open about the five clusters
The latent components are only modestly related to symptoms. Brain scores correlated with symptom scores at r = 0.1798 for amplitude correlation and r = 0.2046 for phase synchrony. Squaring those values gives roughly 3.2% and 4.2% shared variance, estimated in the same cohort that produced the components.
Three analysis choices shape the final count. With only sex regressed out, the amplitude component stayed significant (P = 0.0145) while the phase component did not (smallest P = 0.0525). The elbow criterion at resolution 0.85 returned six clusters, and a two-patient cluster was dropped as a probable outlier group to leave five. Adding second latent components kept clusters 2 and 3 intact and split the others further.
The authors' stability checks answer a narrower question. Rerunning the full pipeline on 1,000 random 80% subsamples reproduced the phenotypes, and a decision-tree classifier assigned individuals to their clusters with above 96% mean accuracy. Those tests show the clusters are reproducible within one sample. They say nothing yet about whether membership predicts treatment response or recurs in other populations.
The sample sets further bounds. Participants were Finnish-speaking and presumed white (ethnicity was not collected), and the patients came from a randomised trial of a game-based digital therapy that randomised 1,001 patients, so the 263 MEG patients are volunteers from about a quarter of that trial. People with suicidality, psychosis or neurological disorders were excluded. Patients were 62% female against 39% of controls, and symptoms came from self-report questionnaires.
The authors expect MEG to serve specialist settings first, where a circuit-level readout could inform treatment stratification or neuromodulation targeting, and they describe the phenotypes as candidate markers rather than diagnostics. A minimal dataset on Dryad holds age- and sex-regressed node-strength arrays and z-scored symptom scores, and the coupling code sits in the CrocoPy toolbox, so independent groups can rerun the clustering. Response to treatment, broken out by cluster, is the result that would show whether the five groups matter clinically.

A Seven-Day Water Fast Moved 1,044 Blood Proteins, and Day 3 Was the Turning Point
A 7-day water fast changed 1,044 blood proteins, few before day 3. A second 2025 cohort shared 49 significant hits with no conflicting direction of change.

Paricalcitol and Pancreatic Cancer: Safety Data Published, Phase 2 Not Pursued
Paricalcitol plus gemcitabine and nab-paclitaxel in 36 patients: 42% of the oral arm had grade 2–4 hypercalcemia, and the registry says phase 2 was not pursued.

Mouse and Stem Cell Data Show the Brain Has Two Separate Origins
A Stanford lineage-tracing study finds two separate progenitor cells, marked by Otx2 and Gbx2, build the forebrain/midbrain and hindbrain from gastrulation.
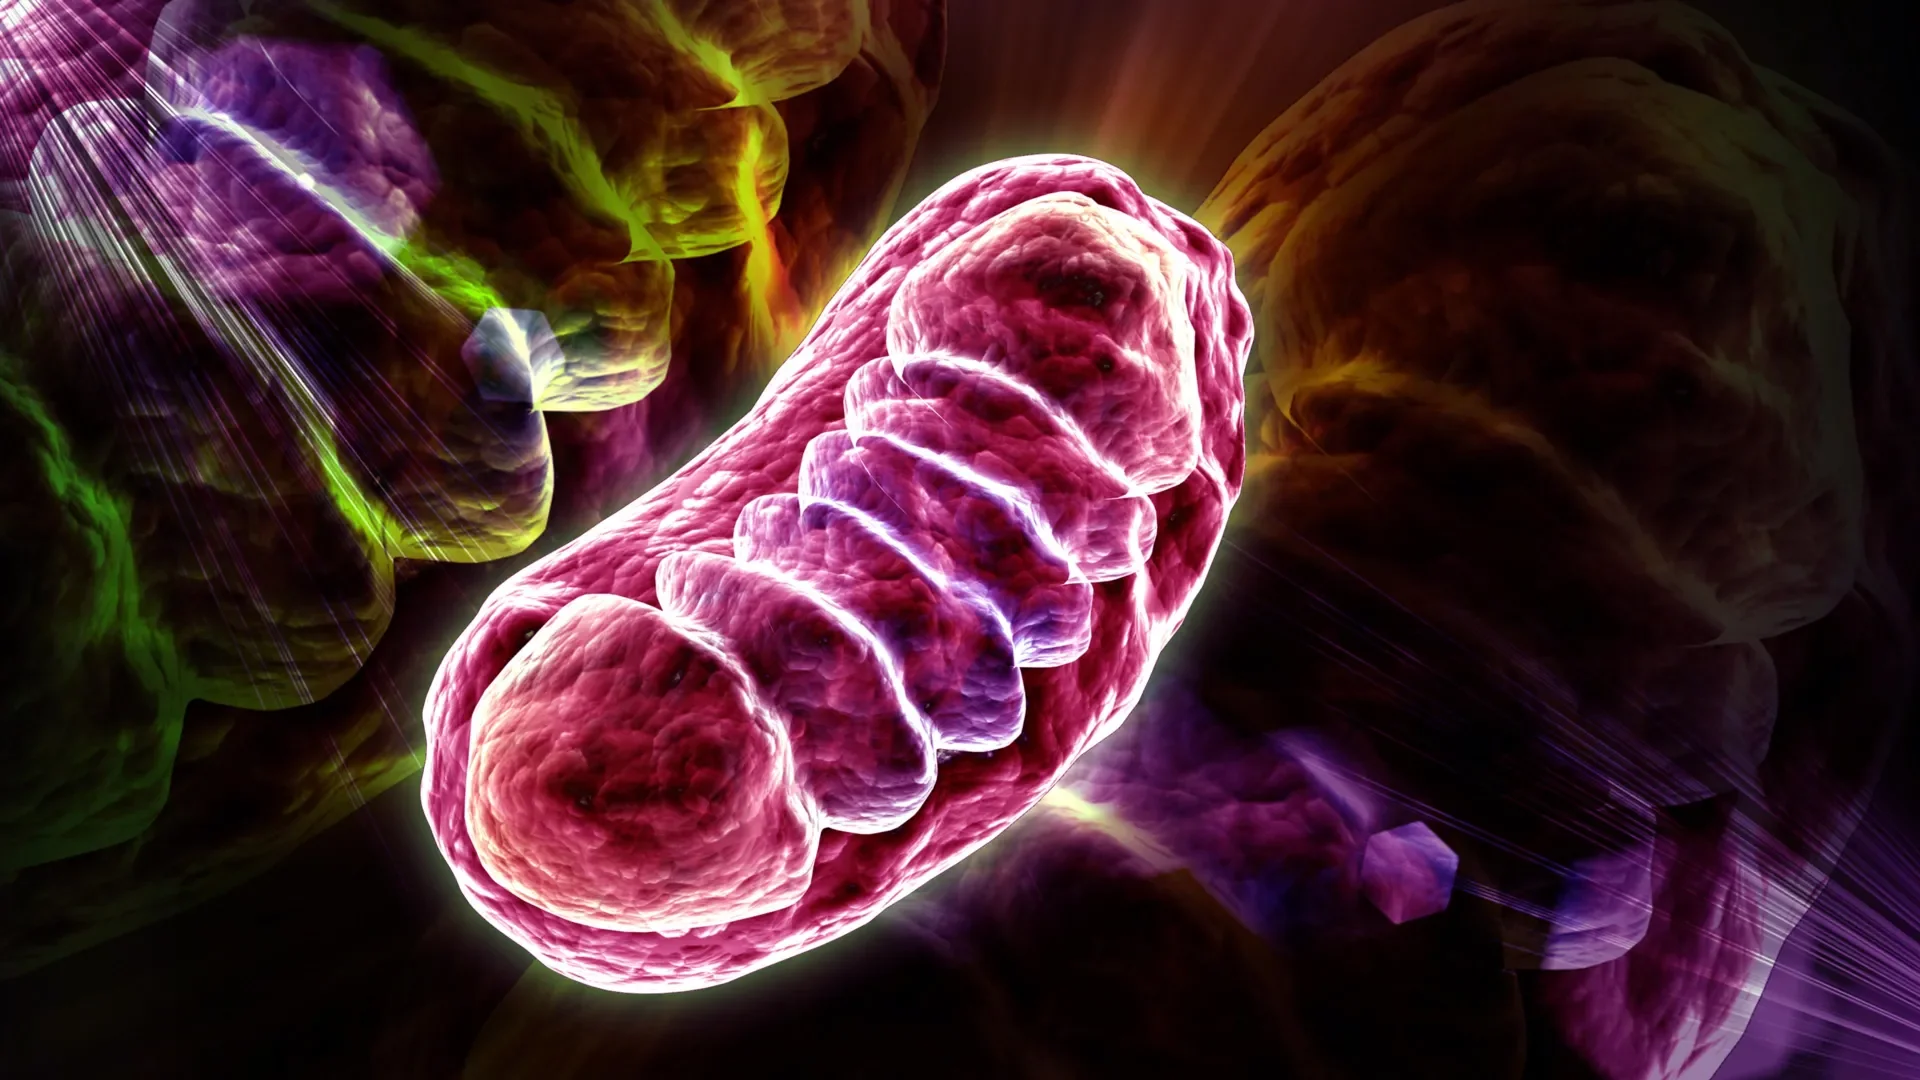
Mitochondria's Acetyl-CoA Switch Explains How 'Zombie' Cells Fuel Chronic Inflammation
Senescent 'zombie' cells use a mitochondrial acetyl-CoA switch to activate inflammatory SASP genes, and blocking it eased frailty in aged mice, Nature reports.
Comments (0)
Please sign in to join the discussion.
No comments yet.
Be the first to share your perspective on this topic.