

The government's headline jobless rate and an advocacy-backed alternative measure are telling two very different stories about the same July labor market, and the gap between them is widening.
The Ludwig Institute's Alternative Measure Puts Joblessness Near 25%
The Bureau of Labor Statistics put the U.S. unemployment rate at 4.1% in July, a level most economists consider healthy. The Ludwig Institute for Shared Economic Prosperity uses a different yardstick, and it produces a far higher number.
LISEP's "True Rate of Unemployment," or TRU, counts people who are unemployed and looking for work, people working part-time involuntarily, and people working full-time but earning less than $26,000 a year before taxes, which the institute treats as a poverty-level wage. By that definition, 24.9% of workers were "functionally unemployed" in July, the fourth straight monthly increase, though still down from 25.2% in December.
LISEP chairman Gene Ludwig said the four-month climb is worth watching alongside a falling labor-force participation rate. In a statement, he said a strong labor market should pull more people into the workforce, not fewer. The gap between the two measures, 24.9% versus 4.1%, is 20.8 percentage points, a spread this wide only shows up because TRU counts underemployment and low pay that the official rate does not touch.
Not every economist treats TRU as a reliable signal. Gregory Daco, chief economist at EY-Parthenon, told CBS News that an unemployment reading in the 20% range does not match anything else visible in the U.S. economy right now. That disagreement is real and unresolved: LISEP is reading the trend as an early warning, while a mainstream forecaster is treating the level itself as implausible given everything else the data shows.
July's Payrolls Report Missed Forecasts by Nearly 120,000 Jobs
The functional-unemployment debate is happening against a payrolls report that came in weaker than expected on its own terms. Economists polled by FactSet had forecast employers would add 95,000 jobs in July. Instead, employers cut 23,000 positions, a miss of roughly 118,000 jobs. Local government education lost 50,000 positions and retail lost 19,000, while healthcare, this year's main source of payroll growth, added 22,000.
The Labor Department also revised down its May and June job counts by a combined 103,000, meaning hiring earlier this year was weaker than first reported. Markets expert and former Goldman Sachs analyst Nic Puckrin said hiring had effectively gone into reverse and that some of the jobs counted in prior months turned out not to have existed.
The 4.1% headline rate itself fell from 4.2% in June, but for a reason that undercuts the improvement: workers left the labor force rather than found jobs. Labor-force participation dropped to 61.4% in July, the lowest level since February 2021. Economic Policy Institute senior economist Elise Gould said people who don't see opportunities for themselves stop actively looking, which removes them from the count entirely. A Federal Reserve Bank of St. Louis analysis found part of that decline traces to a change in how the Labor Department calculates population data, a methodological factor layered on top of any change in worker behavior. Indeed Hiring Lab senior economist Cory Stahle pointed to retirements and tighter immigration policy as additional forces pulling people out of the workforce.
Wages Are Losing Ground to Inflation While Fewer People Look for Work
Even workers who kept their jobs are not gaining ground. The Consumer Price Index rose at a 3.4% annual pace in July, while wages rose 3.2% over the same period, so pay growth is trailing inflation rather than outpacing it. EY-Parthenon's Daco said employers are moderating wage growth to control costs and hold onto the workers they need at the price they want to pay, which limits how much income growth can support consumer spending, the driver of roughly two-thirds of U.S. economic activity.
The picture is not uniformly weak. LinkedIn's head of economics for the Americas, Kory Kantenga, described hiring as slow rather than collapsing, with job postings largely flat and rising competition per opening. Layoffs recently hit a two-year low, and the four-week average of initial jobless claims fell below 200,000 for the week ending Aug. 1, the first time it had dropped that low since October 2022. Fed Governor Lisa Cook noted that the unemployment rate has stayed low largely because both hiring and layoffs are low at the same time, an unusual combination rather than a simple downturn.
That mixed record leaves the Federal Reserve with a genuinely open call. At the July meeting, three FOMC members voted to raise rates while nine voted to hold. Morgan Stanley Wealth Management's Ellen Zentner said the surprise job loss could ease pressure on the Fed to raise rates at its Sept. 15-16 meeting, but that upcoming inflation data will be the deciding factor. If inflation comes in hotter than expected, a cooling labor market may not be enough to head off calls for a hike.
Labor-force participation, at 61.4%, adds a third data point the wage comparison doesn't capture on its own: fewer people are even in the market to bid wages up. None of these measures resolve the dispute over what the labor market actually looks like right now. What they show, together, is that the headline unemployment rate and the underlying payroll, wage, and participation data are no longer moving in the same direction, which is exactly the kind of divergence that made LISEP's alternative measure newsworthy in the first place.

Could AI Create a "Permanent Underclass"? What the Data Actually Shows
Stanford payroll data show AI-exposed 22-25 year-olds losing jobs at 3.8% a year, while wages diverge by income. What that means for a 'permanent underclass.'
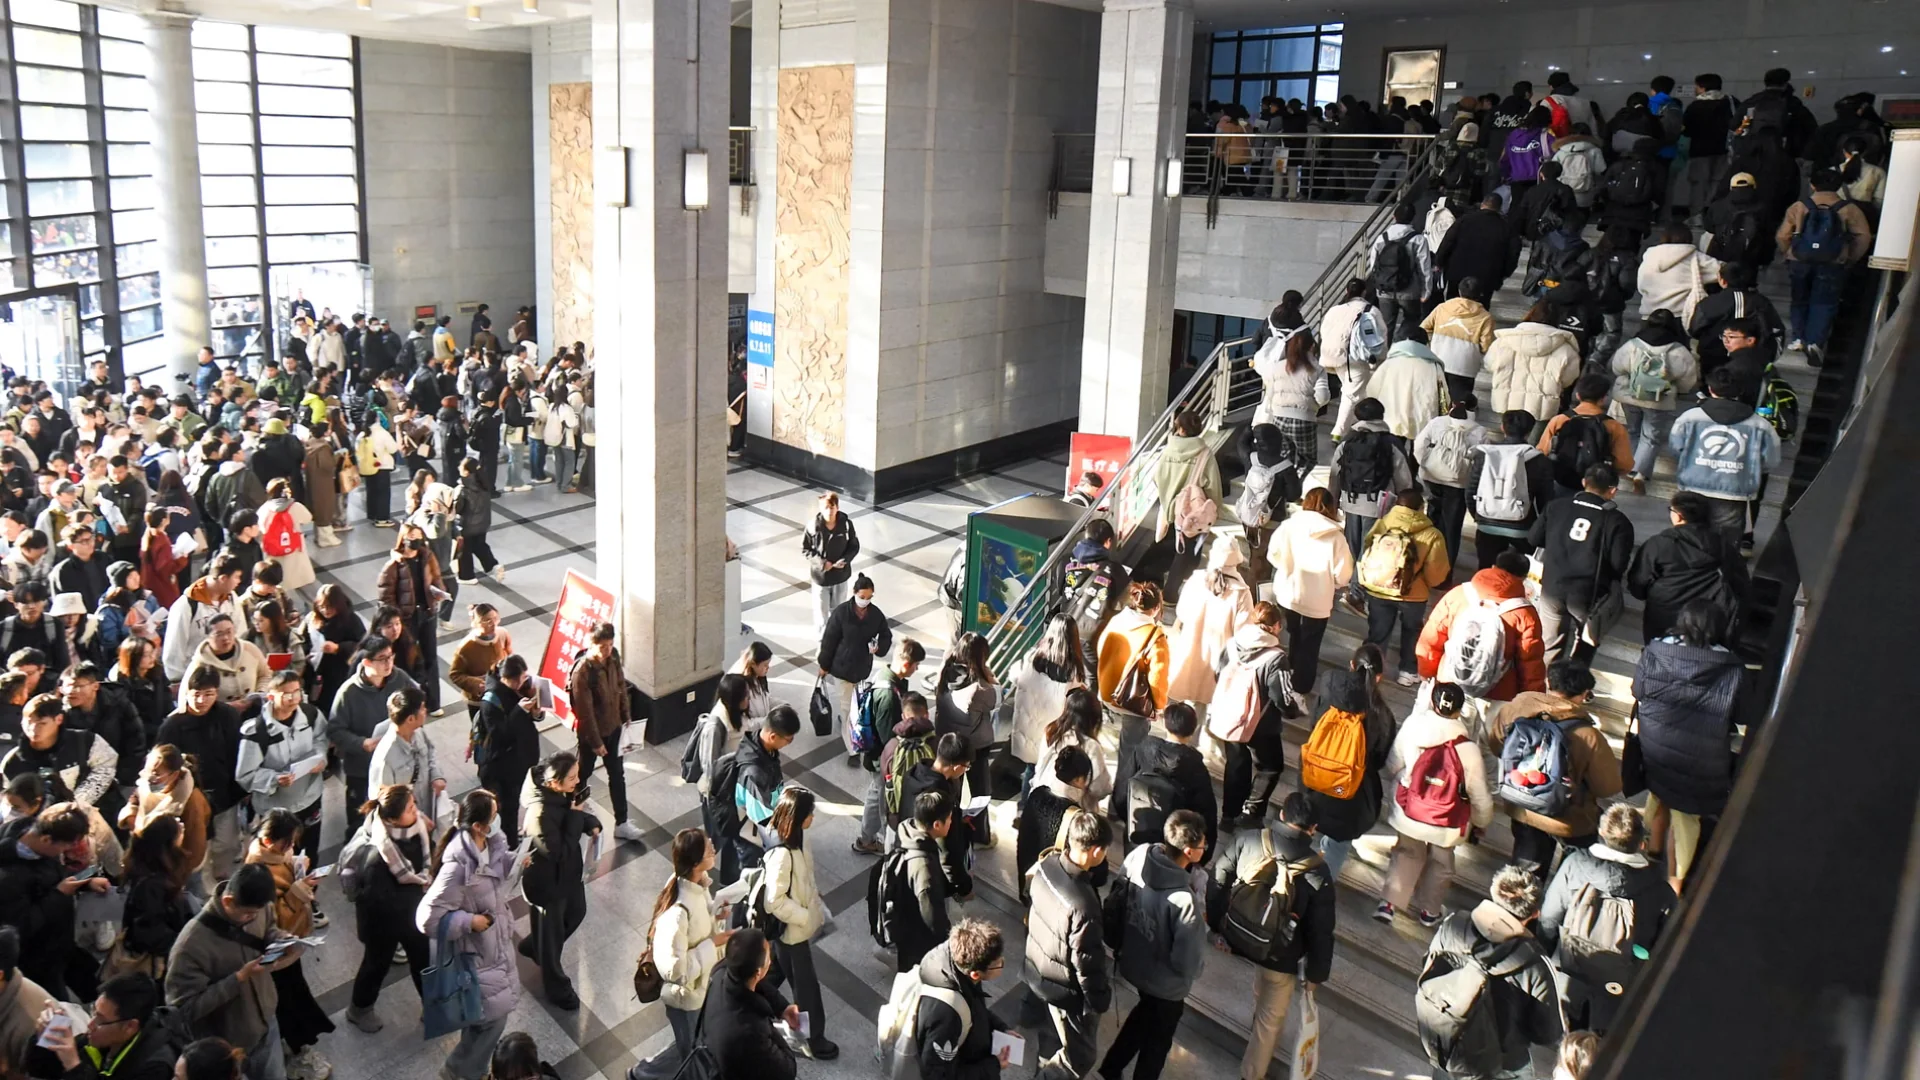
Asia’s Youth Job Squeeze: Inside China’s Record Graduate Influx and Vietnam’s AI Skills Gap
China's record 12.7 million graduates face a 15.6% youth jobless rate as AI reshapes hiring; Vietnam shows the same skills-gap pattern at smaller scale.
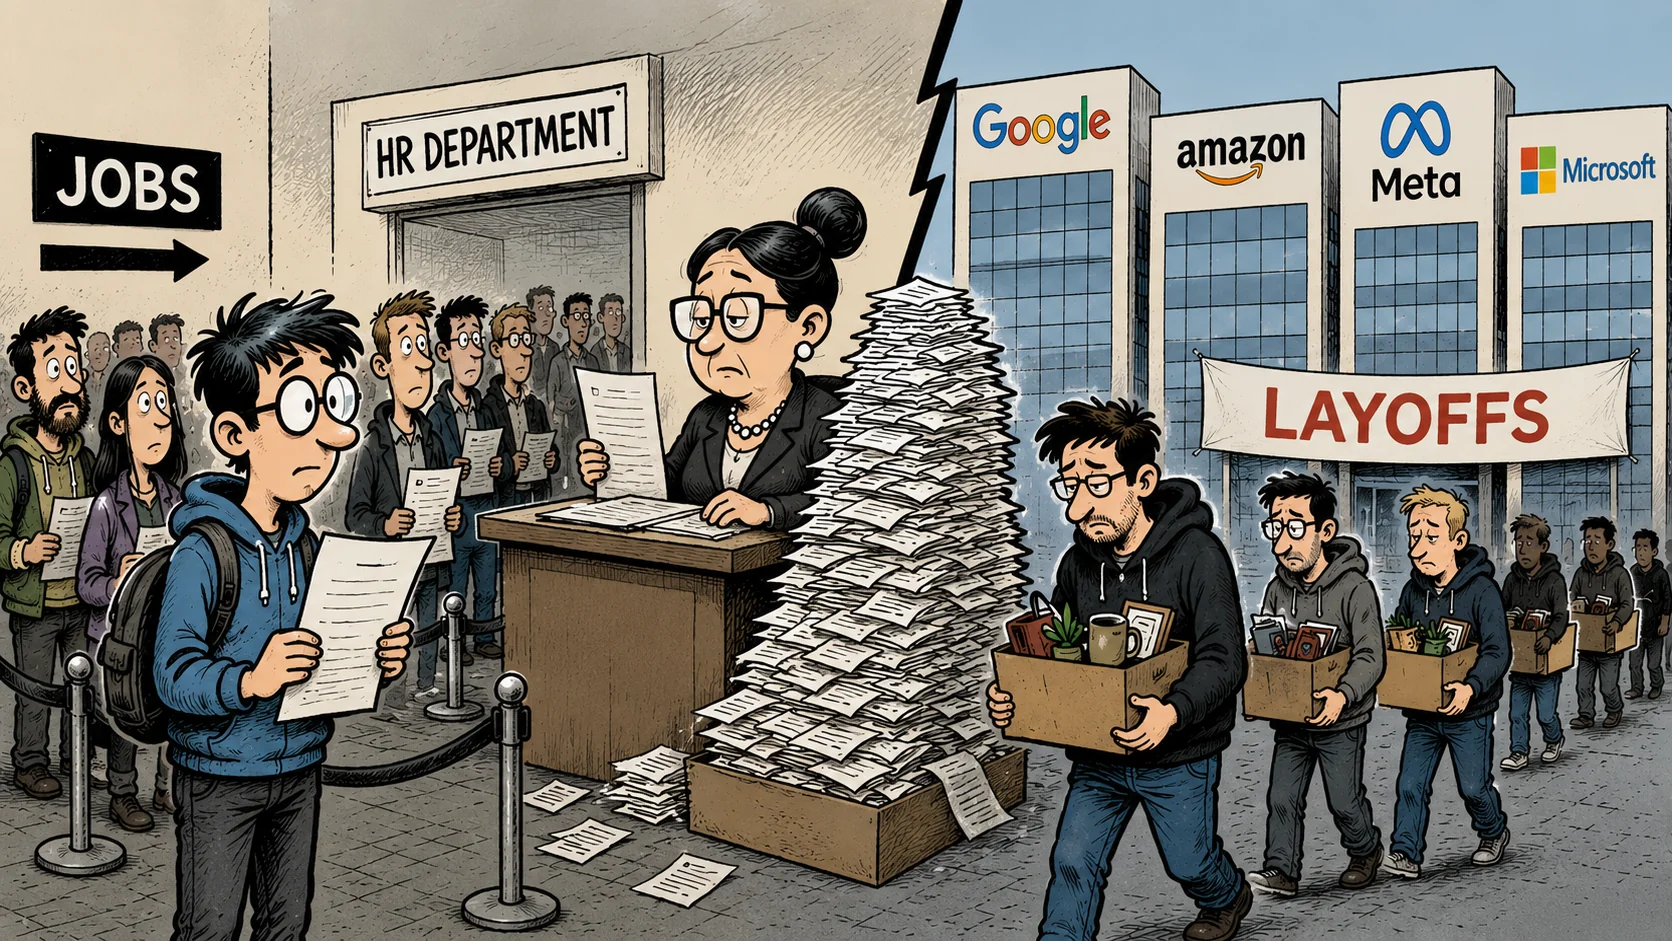
The 4.2% Unemployment Rate Is Hiding a Grimmer Labor Market — And I'm Living Proof
U.S. unemployment fell to 4.2% in June 2026, but a 720,000-person labor force exodus — not hiring — drove the drop. Here's what the real number is, and why it matters for tech.
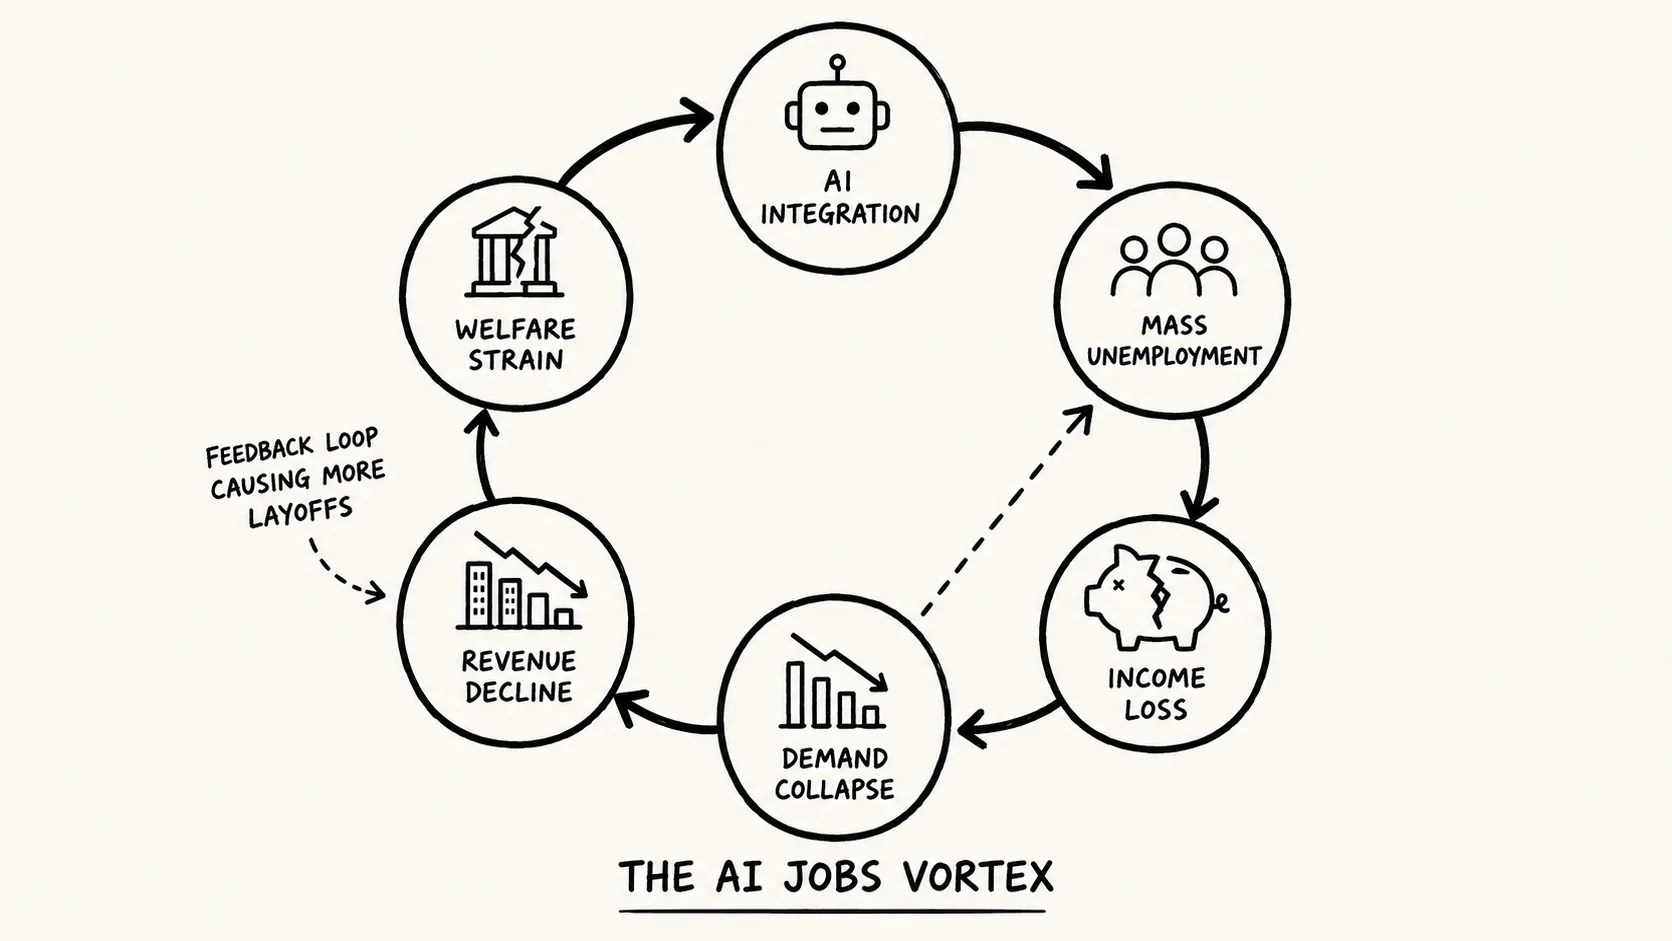
How AI Layoffs Can Trigger an Economic Spiral
A source-grounded explainer on how AI-driven displacement creates a self-reinforcing demand contraction — and what policy interventions are being proposed as circuit-breakers.
Comments (0)
Please sign in to join the discussion.
No comments yet.
Be the first to share your perspective on this topic.