
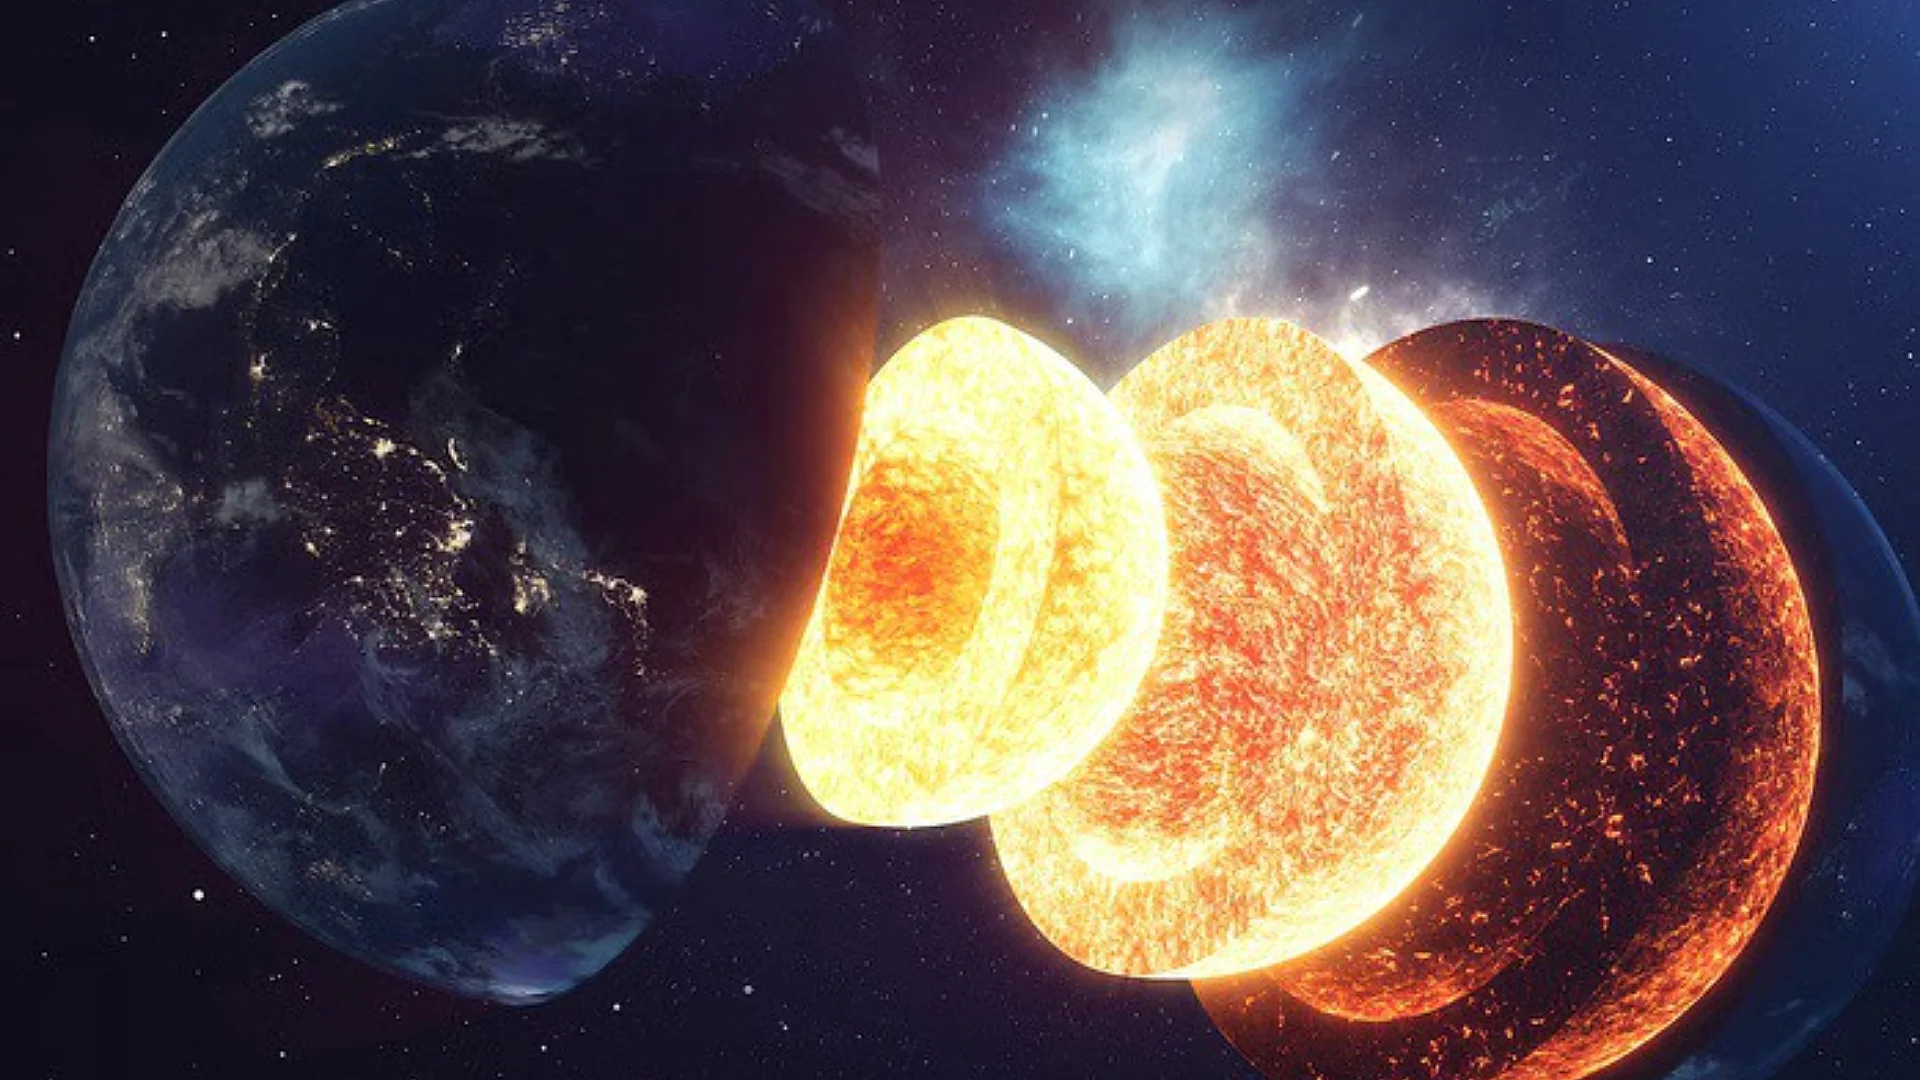
Earth's day lengthens and shortens by several milliseconds over decades. For more than 30 years geophysicists could show the core is responsible without naming the force. A study of day-length records from 1964 to 2019, published on 23 September 2026 by Huifeng Zhang and Mathieu Dumberry of the University of Alberta, gives the leading role to gravity acting between the inner core and the mantle, with electromagnetic and topographic drag at the core-mantle boundary acting as the brake.
Two brakes with the right size and the wrong timing
The signal being explained is the decadal change in length of day (ΔLOD) once atmosphere, ocean, lunar tide, glacial rebound and surface water effects are removed. A low-pass filter with a 30-year cutoff isolates the multidecadal swing of roughly 60 to 70 years, the part the paper models.
The authors predicted the two long-suspected boundary torques from a core flow model that tracks changes in Earth's magnetic field. Electromagnetic torque scales with the conductance of the lowermost mantle, and the paper uses a reference value of 10⁸ siemens, expressed as a dimensionless factor Kem of 1.0. Topographic torque depends on parameters nobody has pinned down, so it is folded into a factor Ktop, set at 0.4. Both then reach the right magnitude, yet the day-length changes they predict run broadly opposite to the observed ones. Changing the two factors rescales the torques and leaves their timing alone, because timing follows the large-scale flow history.
Nature's news report on the result quotes Zhang saying that before the analysis, "we didn't know they are competing with each other."
How a 2.35° inner core swing becomes a gravitational torque
The inner core is slightly non-spherical. Its long equatorial axis is pulled toward alignment with dense anomalies in the mantle, so any rotation away from that alignment produces a restoring gravitational torque on the mantle. The paper writes that torque as Γ times α, where α is the misalignment angle and Γ is a strength factor tied to the size of the mantle's gravity signature at the boundary. East-west outer core flows drag the inner core out of alignment, and gravity pulls it back.
The rotation history comes from a seismic reconstruction of the inner core's motion: a swing of about 2.35° relative to the mantle whose direction flips from prograde to retrograde near 2010. A 2024 waveform study and a 2026 earthquake-sequence analysis support that reversal.
The inner core boundary also relaxes viscously toward alignment on a timescale τ. With Γ = 1.3 × 10¹⁹ N m and τ = 6 years, the predicted gravitational torque matches both the amplitude and the phase of the torque needed to explain the multidecadal ΔLOD. A rigid inner core would have its offset, and so its torque, peak near 2010. Viscous relaxation moves the peak to around 2000, and the fit needs that shift.
The boundary topography is only 11 to 29 metres peak to peak by the paper's estimate. Multiplying the electromagnetic-scenario best-fit Γ of 1.4 × 10¹⁹ N m by one degree (0.0175 radians) gives about 2.4 × 10¹⁷ N m through the paper's Equation 13. That is BytePith arithmetic, not a figure the authors report, but it shows how a fitted offset below 2° can carry a torque of that scale.
The diagram traces the chain the model tests, with the mantle responding to the difference between the two torques.
What 90,000 posterior samples say about torque strength and relaxation time
Several parameter sets fit the data about equally well, so the authors ran a Bayesian inversion with five independent Markov chain Monte Carlo chains that together yielded 90,000 posterior samples. Each sample drew one of 400 core flow realisations and an inner core rotation history within the seismic bounds. The team kept samples with a misfit to the multidecadal ΔLOD below 0.2 milliseconds. Electromagnetic and topographic coupling were tested separately, because their time histories are similar enough that a stronger one can offset a weaker other.
The table sets the two scenarios side by side. Its last row is a product of the reported best-fit values, calculated here.
| Parameter | Electromagnetic scenario | Topographic scenario |
|---|---|---|
| Γ, best fit (95% interval), 10¹⁹ N m | 1.4 (0.6 to 2.2) | 1.5 (0.6 to 4.2) |
| τ, best fit (95% interval), years | 10.2 (4.1 to 30.5) | 7.8 (1.7 to 21.5) |
| Boundary factor, best fit (95% interval) | Kem 1.08 (0.05 to 2.89) | Ktop 0.23 (0.01 to 0.83) |
| Γ × τ from the best-fit values, 10²⁰ N m yr | 1.4 | 1.2 |
The topographic scenario shifts Γ upward and τ downward, and their product moves by about 18 percent. The paper explains the trade-off: when relaxation is fast compared with the oscillation period T, the gravitational torque reduces to Γ × τ times the inner core's differential rotation rate, so the data constrain the product better than either factor. That shortcut requires τ to be much shorter than T/2π, which for a 70-year period is about 11 years. The best-fit τ of about 10 years sits at that limit, which may explain why the intervals in the chart below stay wide.
In both scenarios gravity is the larger torque. At the best fits it exceeds the electromagnetic torque by a factor of 1 to 2, and the two are opposed. Best-fit values shift by up to 30 percent between core flow models, and Γ falls in proportion as the assumed inner core rotation amplitude rises.
The chart compares the two relaxation times against that 11-year limit.
What the torque parameters imply for the lowermost mantle and the inner core
Γ converts to the size of the mantle's degree-2, order-2 gravity signature. The paper's range of 0.6 to 4.2 × 10¹⁹ N m corresponds to a peak-to-peak variation in the core-mantle boundary geoid of about 31 to 83 metres, using densities from a standard Earth model. The density contrast at the inner core boundary is itself uncertain, which shifts these numbers.
Mantle convection models reproduce geoid values that low only with two ingredients: large low-velocity provinces built from near-neutrally buoyant thermochemical piles, and a post-perovskite phase two to three orders of magnitude weaker than bridgmanite. The authors call their result tentative support for both.
A relaxation time of 2 to 31 years implies an inner core viscosity of 10¹⁷ to 10¹⁸ Pa s if uniform, or 10¹⁵ to 10¹⁶ Pa s if confined to the top of the inner core. The paper reports agreement with laboratory experiments and ab initio calculations.
If electromagnetic coupling dominates, the best-fit mantle conductance is 1.08 × 10⁸ siemens, with an upper bound of 2.9 × 10⁸. Iron-rich (Mg,Fe)O conducts at 10⁴ to 10⁵ siemens per metre at boundary conditions, so a 2-kilometre layer gives 2 × 10⁷ to 2 × 10⁸ siemens, which brackets the best fit. If topographic coupling dominates, the 0.83 upper bound on Ktop implies a buoyancy frequency at the top of the fluid core below Earth's rotation frequency.
The 10 to 30 year fluctuations the gravitational torque cannot reach
The reconstruction covers the broad multidecadal swing only, because the seismic inner core history has limited time resolution. A τ near 10 years means the gravitational torque works poorly at periods shorter than a few decades. The authors therefore expect the 10 to 30 year core-driven changes to come mostly from the boundary torque. Their electromagnetic and topographic predictions, however, contain no large fluctuations at those periods, pointing to limited flow resolution or coupling models that need refinement.
The torque histories are only as good as the inner core rotation model and the core flow model behind them, and the flow model ends in 2019, which sets the window. Whether the zonal flow pattern behind the 70-year cycle repeats is unknown. Flows in 1915 to 1949 hint at a resemblance to 1985 to 2019, with notable differences.
The long-term balance offers one checkable prediction. Balancing the mean westward boundary torque against gravity implies a permanent eastward misalignment of 1.2° and a steady eastward inner core rotation of 0.12° per year. Over the 9,000 years for which palaeomagnetic data indicate the westward flow has persisted, that rate accumulates to close to three full turns relative to the mantle. The authors have posted the data and scripts behind every figure, so the fit can be rerun against other inner core histories.
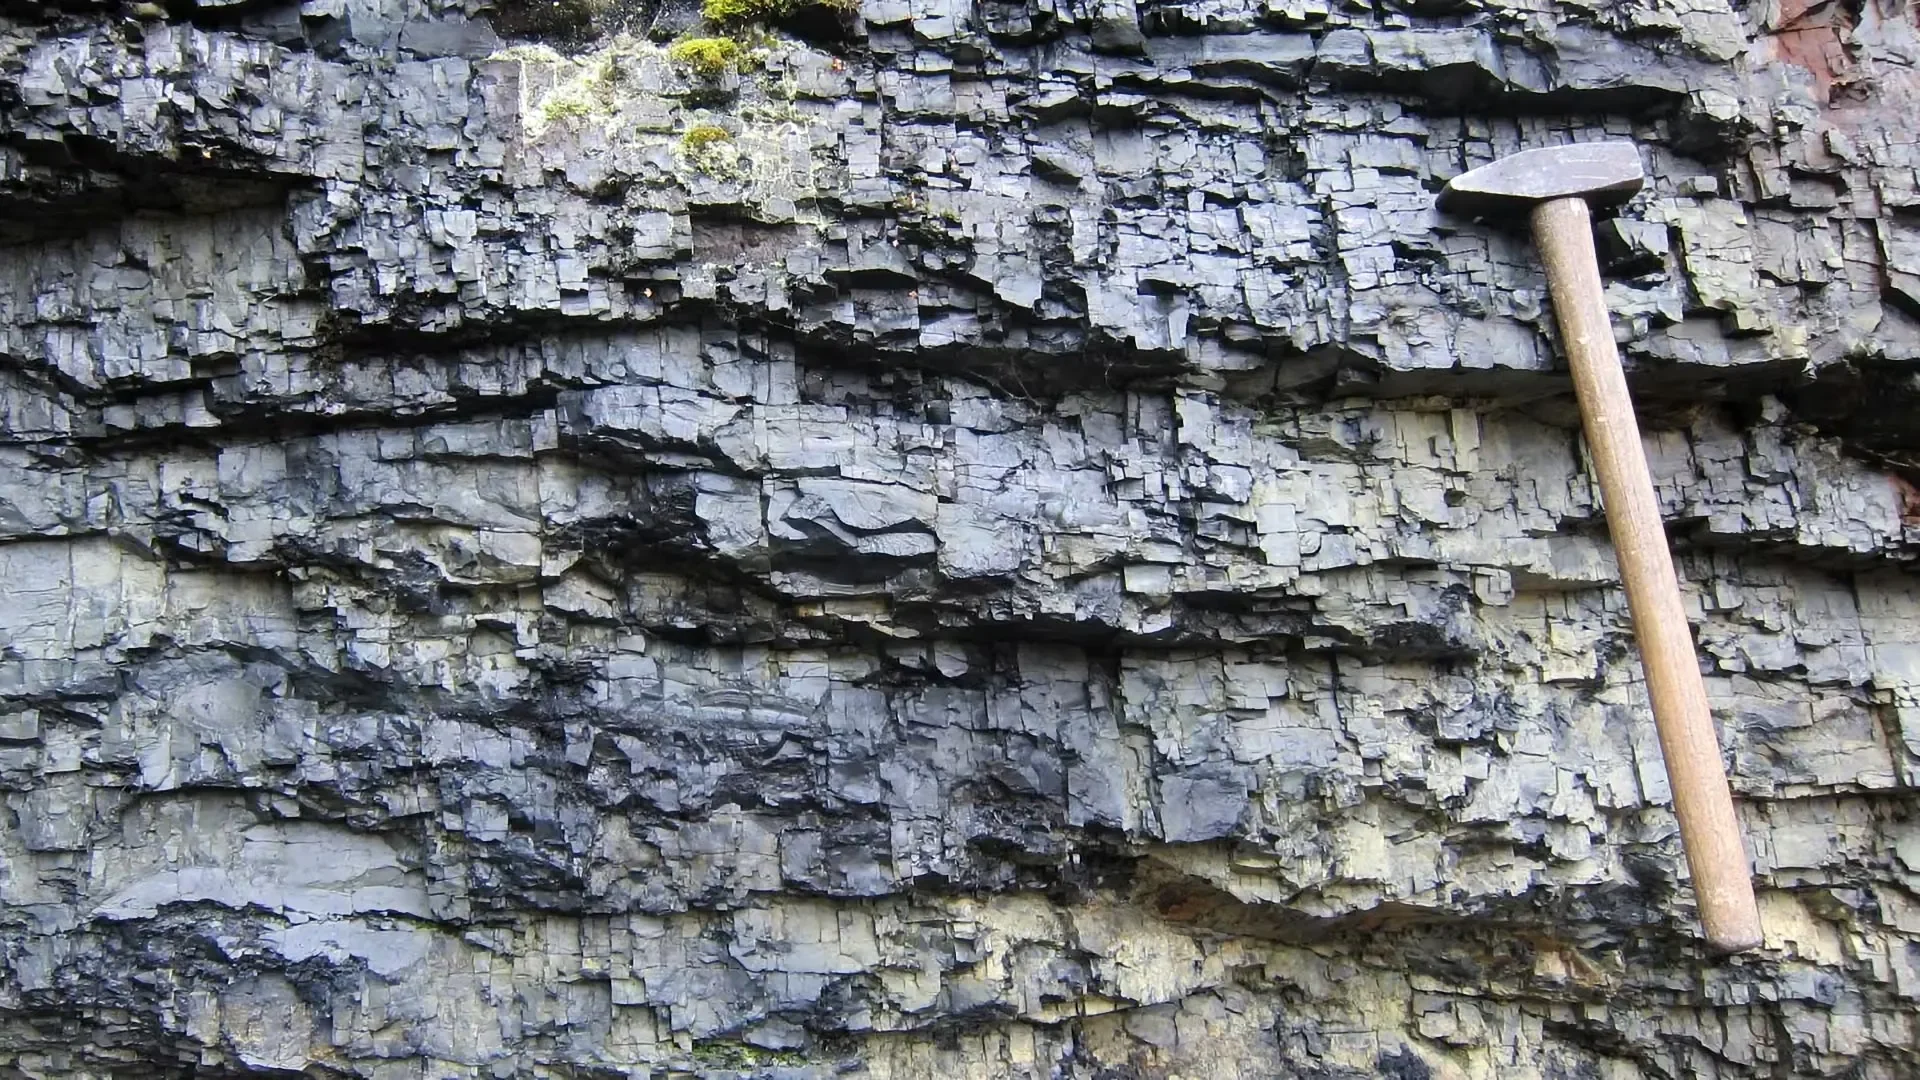
Trapped Gases Suggest a Famous 2-Billion-Year-Old Carbon Signal Was Local
Trapped gases from Karelia's Zaonega Formation show a 72-350°C gradient beside a 2-billion-year-old magma sill, reframing a global carbon signal as local.

Why Some Tilted Hurricanes Quickly Align, and Others Stay Leaning
New analysis of 1,510 NOAA Hurricane Hunter radar scans reveals why some tilted tropical cyclones quickly align vertically while others stay leaning and weak.
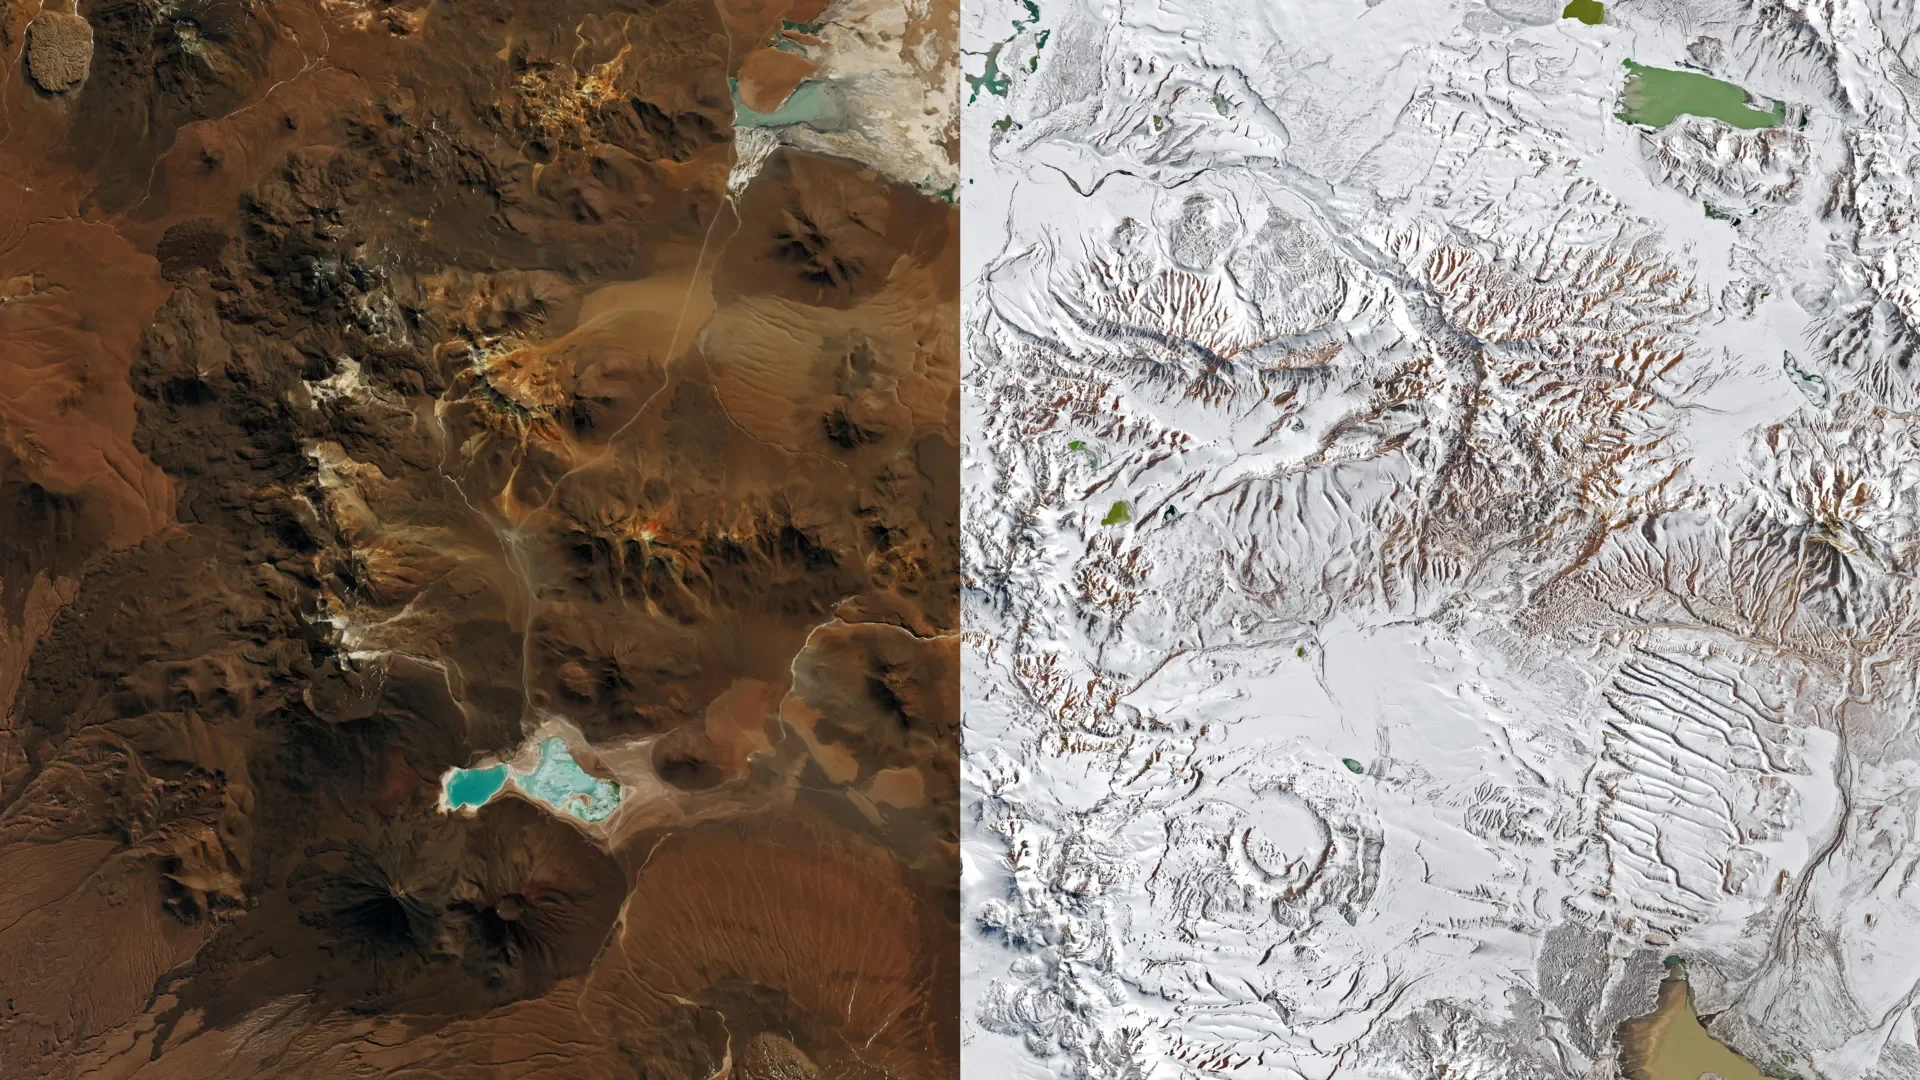
Storms Bury the Atacama Desert in Snow, Dump Ten Times Normal Rain on the Coast
Back-to-back storms buried Chile's Atacama Desert in snow, halted the ALMA telescope, and dumped 10x normal rain on Taltal amid a strengthening El Niño.

Ship Data Show Iodine and Sulfur Chemistry Seeding Arctic Clouds
A five-week Greenland ship campaign found iodine and sulfur acids seeding Arctic particles, then organic vapors grew them into far more cloud-seeding nuclei.
Comments (0)
Please sign in to join the discussion.
No comments yet.
Be the first to share your perspective on this topic.